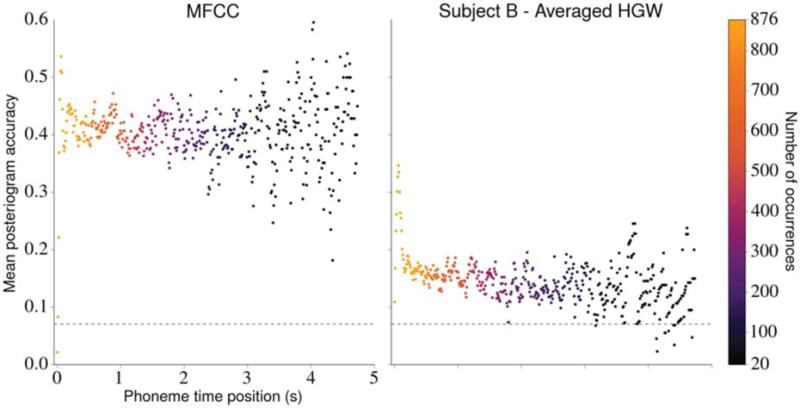
Figure 9.

The effect of phoneme time position on posteriogram accuracy. Utterance onsets occur when a non-silence phoneme occurs after a silence duration lasting 500 ms or longer. The mean posteriogram accuracies were computed using estimated posteriograms associated with each stimulus in the Gump set generated with MFCCs (left) and averaged HGWs from subject B (right). Each dot represents the mean posteriogram accuracy associated with a phoneme time position, and the color of the dot indicates how many utterances contained a non-silence phoneme at that position. Phoneme time positions that were present in fewer than 20 of the stimuli and all silence phonemes were excluded from the figure. The horizontal dashed line in each plot depicts chance posteriogram accuracy. The apparent heteroscedasticity in each plot is most likely caused by the decreased number of occurrences of non-silence phonemes in the latter part of the utterances (because the utterances differ in duration), which led to less confident predictions of the mean accuracy at those time points. Testing with mixed effects logistic regression models revealed statistically significant negative relationships between phoneme time position and classification accuracy for neural features but not for MFCC features.
