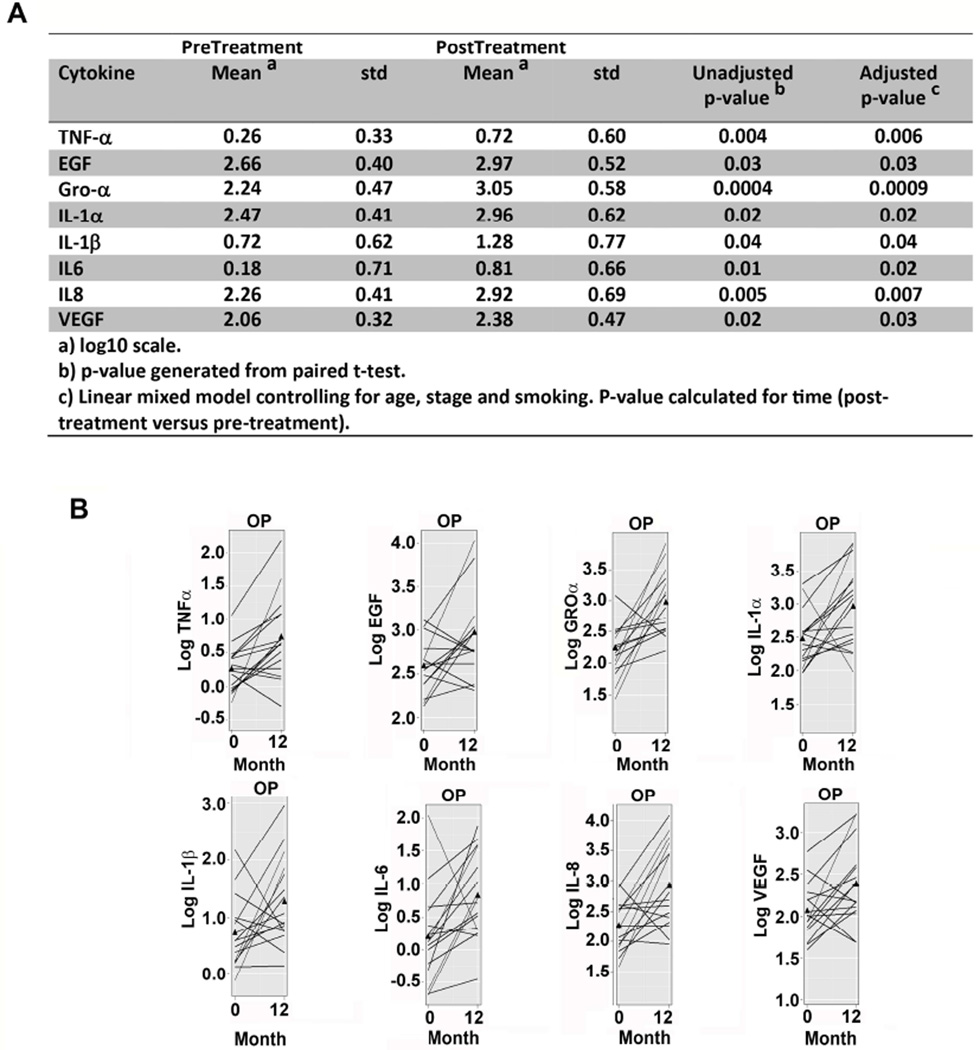
Figure 2. Change in cytokines pre- to post-treatment.
A) Univariate and multivariate analyses for pre- to post-treatment change from linear mixed model. Information about the model is provided in the footnote. B) Pre-treatment to post-treatment volume normalized cytokine levels. Each line represents a different patient and values are log-transformed.

