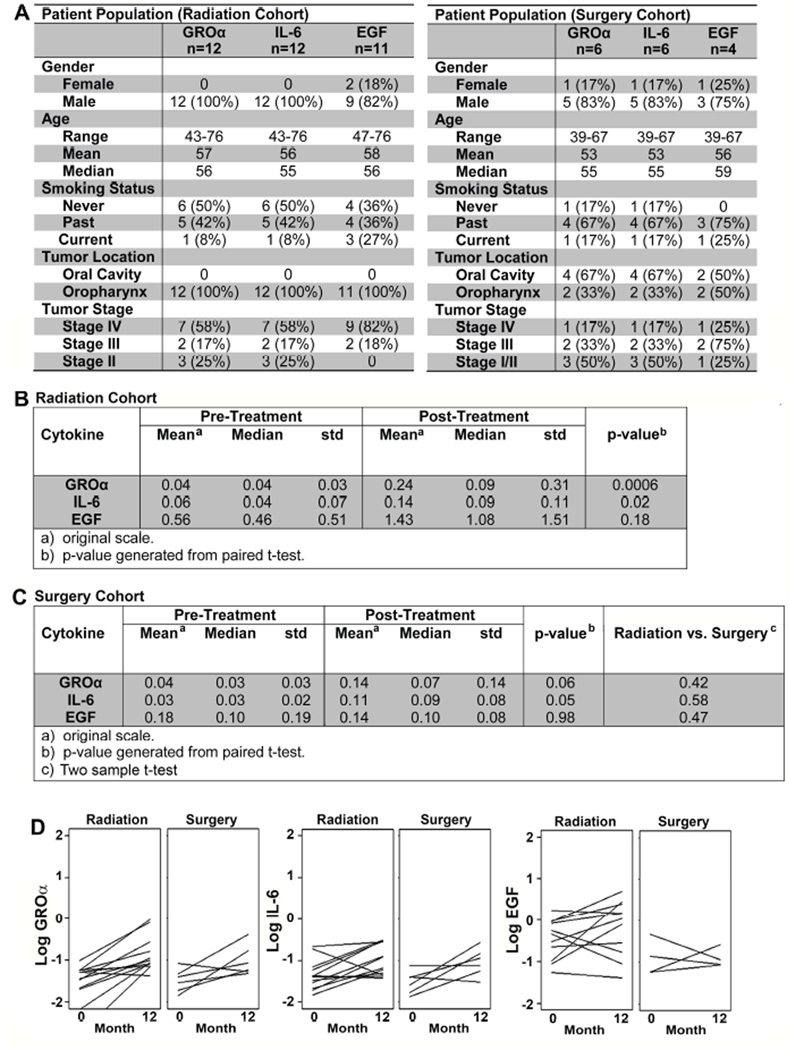
Figure 3. Validation of GROα, IL-6 and EGF in an independent radiation cohort.
A) Patient demographics within radiation (left panel) and surgery (right panel) cohorts. B and C) Mean, and standard deviation (std) of pre- and post-treatment GROα, IL-6 and EGF in: B) Radiation cohort. The original samples were analyzed using the Multiplex cytokine array and the validation cohort was analyzed via ELISA, hence the difference in scale. C) Surgery cohort. p-values from paired t-test. D) Pre-treatment and post-treatment cytokines in radiation and surgery cohorts. Each line represents a different patient.

