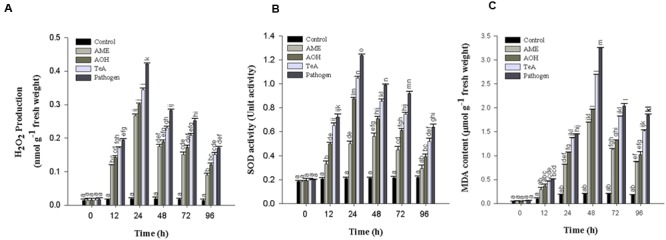
FIGURE 6.

(A) Production of Hydrogen peroxide (H2O2), (B) Superoxide dismutase (SOD), and (C) Lipid peroxidation (MDA content) in tomato plant at different time intervals infected by A. alternata and treated with its toxins. The results are expressed as the mean of three replicates and vertical bars indicate the ±SD of the mean.
