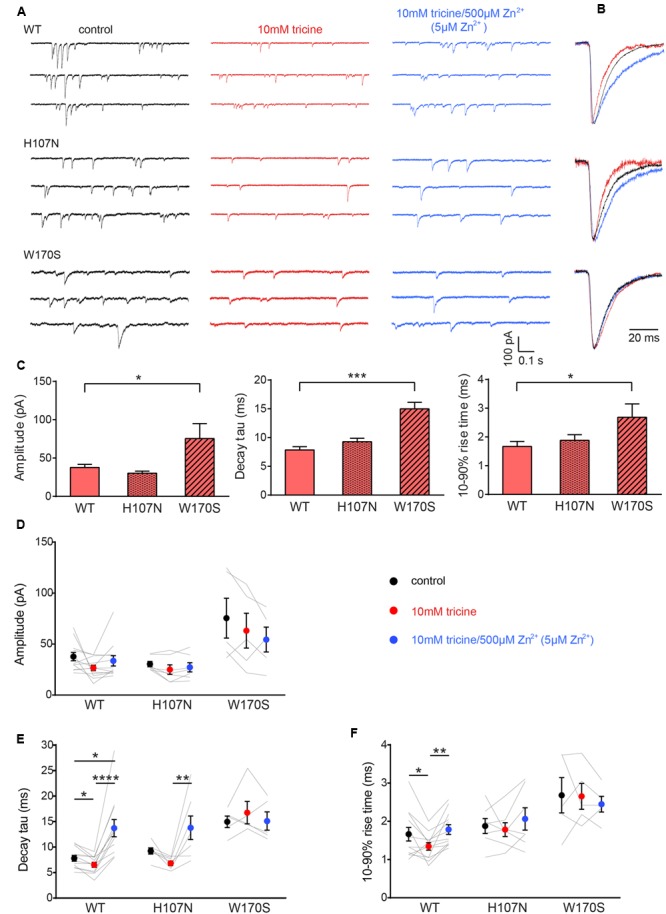
FIGURE 1.

Effects of synaptic Zn2+ on spontaneous IPSCs mediated by α1β, α1H107Nβ, and α1W170Sβ GlyRs. (A) Representative recordings of IPSCs mediated by the indicated constructs are shown in the presence of tricine-free solution (black traces), 10 mM added tricine (red traces) and 10 mM added tricine + 500 μM added Zn2+ (=5 μM free Zn2+: blue traces). (B) Superimposed, digitally averaged, normalized IPSCs from the corresponding cell in (A). The total number of events included in each averaged IPSC was as follows: α1β GlyR (control: 86; 10 mM added tricine: 63; 10 mM added tricine + 500 μM added Zn2+: 92), α1H107Nβ GlyR (control: 72; 10 mM added tricine: 56; 10 mM added tricine + 500 μM added Zn2+: 89), α1W170Sβ GlyR (control: 53; 10 mM added tricine: 61; 10 mM added tricine + 500 μM added Zn2+: 68). (C) Comparison of mean IPSC amplitude, decay time constant and 10–90% rise time for the three constructs in tricine-free solution. Statistical significance was determined by Mann–Whitney U-test. The distributions in WT and W170S values differed significantly for amplitude(U = 11, ∗p < 0.05), decay time constant (U = 0, ∗∗∗p < 0.001) and 10–90% rise time (U = 10, ∗p < 0.05). (D–F) Comparison of the effects of the indicated solutions on IPSC amplitude, decay time constant and 10–90% rise time for the three constructs. Comparisons between the constructs are not shown. Statistical significance was determined by Friedman test with significance represented by ∗p < 0.05, ∗∗p < 0.01, ∗∗∗p < 0.001, ∗∗∗∗p < 0.0001. Relative to their values in 10 mM tricine, the decay time constants for α1β and α1H107Nβ GlyRs increased by 74 ± 13% and 50 ± 24%, respectively, in standard extracellular solution and by 109 ± 15% and 101 ± 28%, respectively, in 5 μM free Zn2+. We analyzed 12 cells expressing α1β GlyRs, seven cells expressing α1H107Nβ GlyRs and five cells expressing α1W170Sβ GlyRs.
