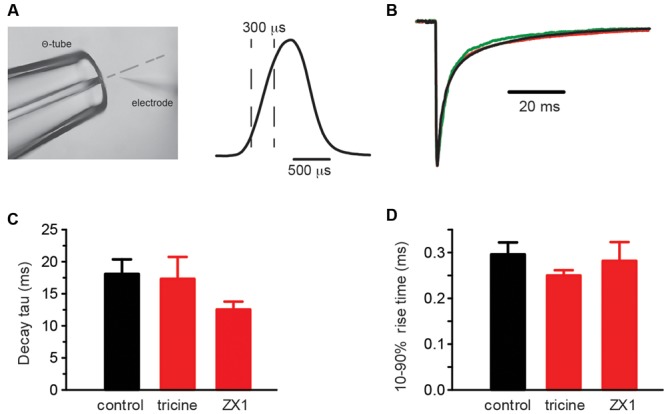
FIGURE 3.

Control experiments employing rapid solution exchange over macropatches expressing α1β GlyRs. (A, left) Image of the double-barrelled Θ-tube used to perform the rapid solution exchange experiments on macropatches. The image also shows an open recording pipette and the position of the solution interface (broken line). (Right) Open pipette response obtained by switching the solution over the electrode tip from the standard extracellular solution to one diluted to 50% with water. The rise and decay times are approximately 300 μs. (B) Overlayed macropatch recordings (averages of 6–20 sweeps) of control (black, 1 mM glycine) and co-application of 1 mM glycine with either 10 mM tricine (red) or 100 μM ZX1 (green). (C) Summary bar plots of the weighted decay time constant for control and the two Zn2+ chelators. (D) Summary bar plots of the rise times for control and the two Zn2+ chelators. Mann–Whitney U-test revealed no significant differences in the distributions of either the decay or rise times, p > 0.05 for both, n = 3–8 macropatches for each condition.
