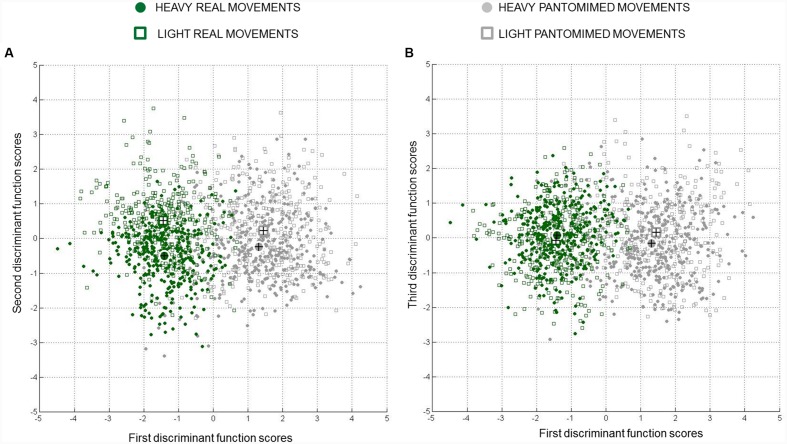
FIGURE 3.
Combined-group plots for centroids and canonical discriminant function scores. Group centroids (bigger circles and squares) and individual scores (smaller circles and squares) for (A) the first vs. second discriminative functions, and (B) the first vs. third discriminative functions are represented. The x-axis shows that the first function separated real vs. pantomimed grasps, whereas the y-axis shows that the second and the third functions separated the movements toward heavy and light object. Note that cases near a centroid are predicted as belonging to that group. Data for all participants in the sample are presented.

