Figure 5.
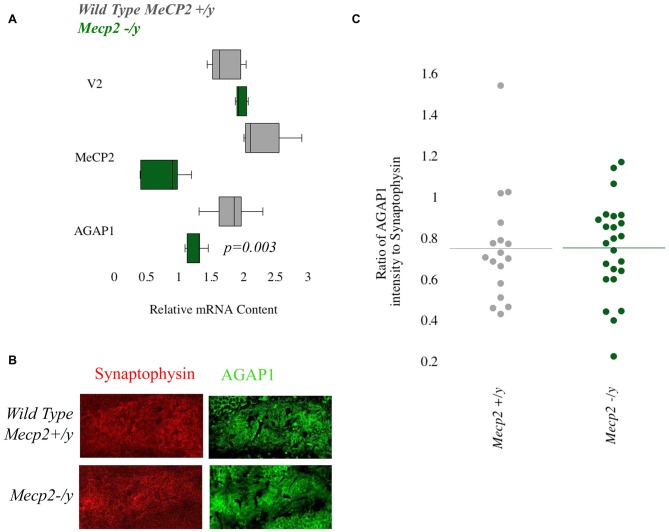
Null mutations of Mecp2 reduce mRNA but not protein levels of AGAP1. (A) Relative mRNA levels in the hippocampus for WT (gray) and Mecp2−/y (green). Negative control Vamp2 (V2) and positive controls Mecp2. No significant difference was measured for mRNA levels of V2. In Mecp2−/y, there was a significant decrease of Mecp2 (p = 0.005). AGAP1 mRNA levels were significantly decreased in Mecp2−/y (p = 0.003). (B) Micrographs of the dentate gyrus at 20× for WT and Mecp2−/y. In red is synaptophysin and in green is AGAP1. (C) Quantification of the intensity levels of AGAP1 compared to synaptophysin in Mecp2−/y mice. AGAP1 intensity levels were not significantly decreased in Mecp2−/y (p = 0.6).

