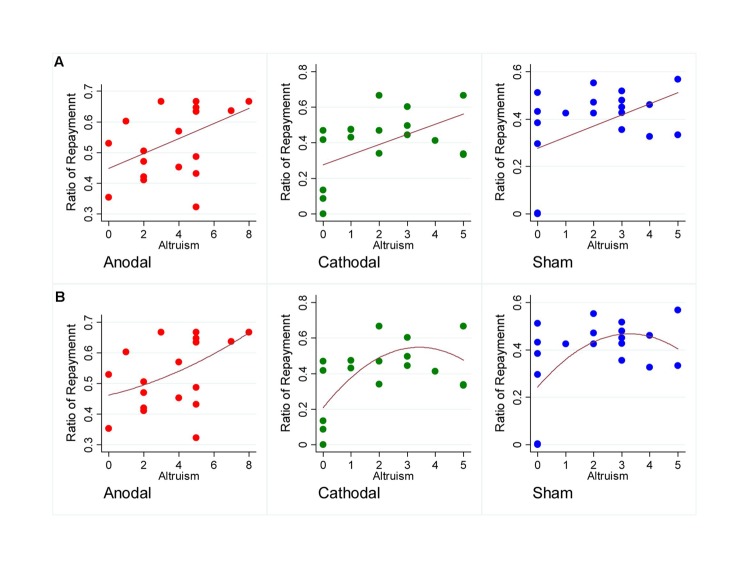
FIGURE 4.
Scatter plots of participants. The horizontal axis represents the mean repayment rate and the vertical axis represents the altruistic preference. (A) The line of best fits for scatter plots of participants receiving different stimulations. (B) The quadratic curve of best fits for scatter plots of participants receiving different stimulations.

