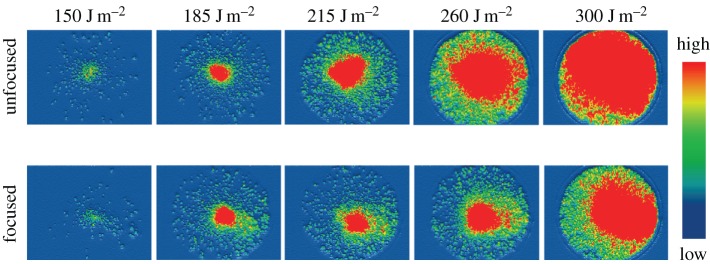
Figure 3.
Spatial distribution of ions at detector surface under various experimental conditions. The upper row shows that ion distribution increases with laser fluence. The ion distribution exceeds that of the detection area with the highest laser fluence used in the measurement. The lower row shows that ion distribution can be reduced to obtain correct quantity information by using Einzel lens systems. (Reproduced with permission from Lai et al. [50]. Copyright © 2010 American Chemical Society.)

