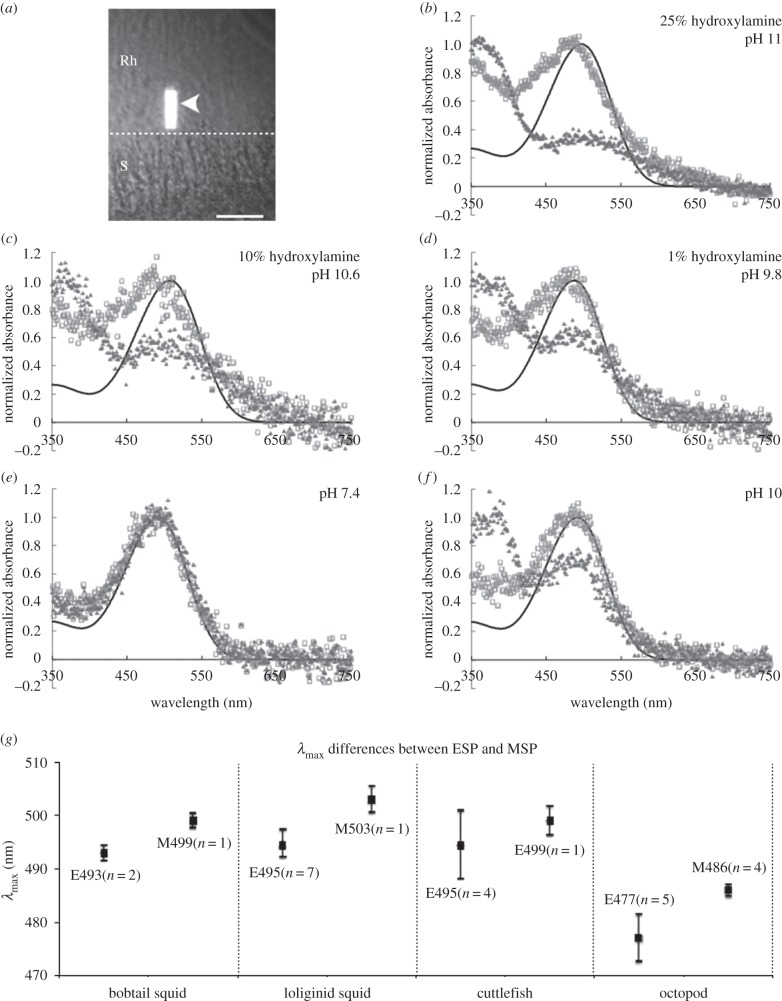
Figure 1.
Samples of coleoid microspectrophotometric measurements using different mountants (I. notoides). (a) A sample of the MSP retinal preparation seen via an infrared image converter. Arrowhead indicates the light beam; S, screening pigment granules; Rh, rhabdominal layer. Scale bar, 20 µm. (b–d) Mean pre-bleached (open grey square) spectra and post-bleached spectra (dark grey triangle) in different concentrations of hydroxylamine solution. Pre-bleached spectra are overlaid with the best-fit rhodopsin template (black line). (e) Changes of the paired spectral curves in the standard mountant (λmax shift from 492 to 494 nm). (f) Changes of the paired spectral curves in the alkaline mountant (λmax shift from 492 to 380 nm). (g) λmax differences between ESP and MSP results (mean ± 1 s.d.) in four coleoid groups. The capital E indicates λmax measured by ESP; M indicates that using MSP; n indicates the number of species.

