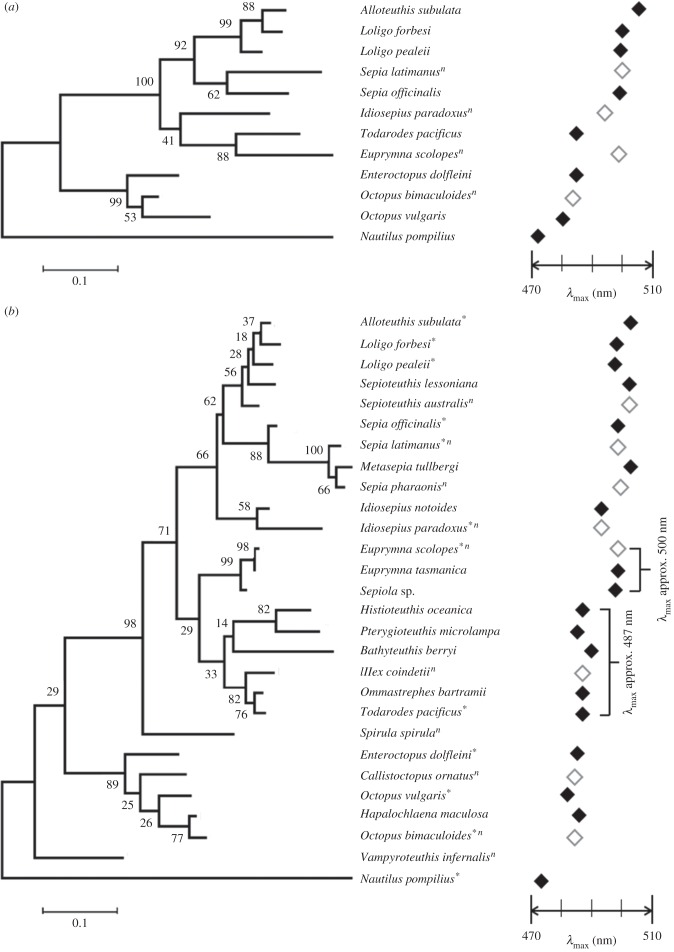
Figure 2.
Maximum-likelihood (ML) phylogeny of cephalopod opsins. (a) The tree constructed using 12 species with the full-length opsin transcripts. (b) The tree constructed using 28 partial opsin transcripts. Both opsin trees showed that a close relationship exists between oegopsid and sepiolid opsins despite their spectral sensitivity differentiating by more than 10 nm. Asterisk next to species name indicates the full-length opsin sequence; n next to species name indicates no available λmax values; closed diamonds indicate λmax obtained from MSP or the adjusted ESP values; open diamonds indicate the predictions of λmax values by simply averaging available λmax data from their relatives. The bootstrap values are shown in front of the branch nodes.

