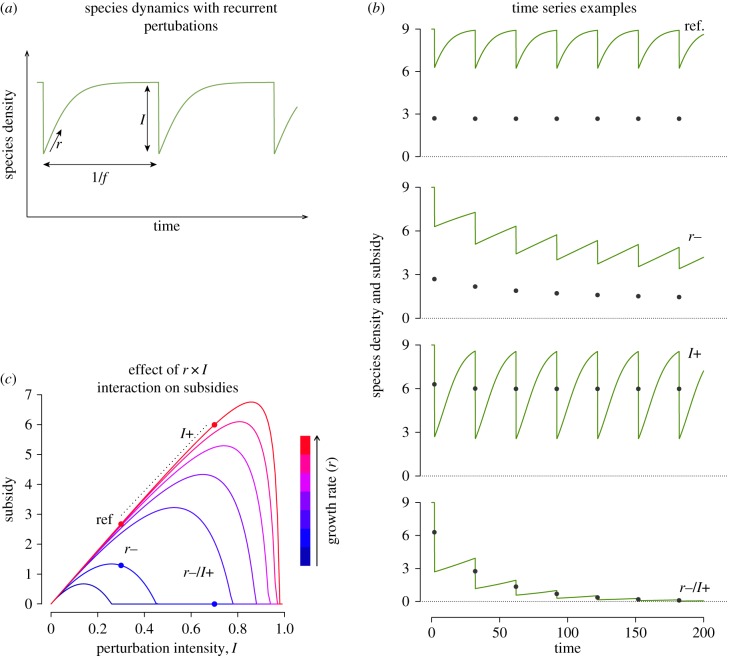
Figure 2.
Interaction between species dynamics, perturbations and subsidies. Results from a simple population model (defined in ‘Material and methods’) showing (a) the changes in density (green solid lines) through time of a species having a logistic growth rate r, submitted to recurrent perturbations of intensity I at a frequency f. The intensity of the perturbation is defined as the proportion of species dying suddenly and turned into subsidies. Panel (b) shows examples of species (green solid lines) and subsidy (grey points) dynamics for different parameter sets. In the top dynamics (‘ref.’), the species can reach its carrying capacity between two perturbations and subsidies are constant. Other dynamics illustrate, from top to bottom, cases with a lower growth rate (r−), a greater perturbation intensity (I+), or both (r−/I+), compared to the top dynamics. Panel (c) shows the variation of subsidies at equilibrium according to perturbation intensity I and for different growth rates r (blue colour refers to low growth rate while red to high ones). Points show the parameter couples used in panel (b). Values of parameters are: K = 9; f = 1/30; in panel (b) r = {0.13,0.02,0.13,0.02} and I = {0.3,0.3,0.7,0.7} from top to bottom; in panel (c)  and
and  . (Online version in colour.)

