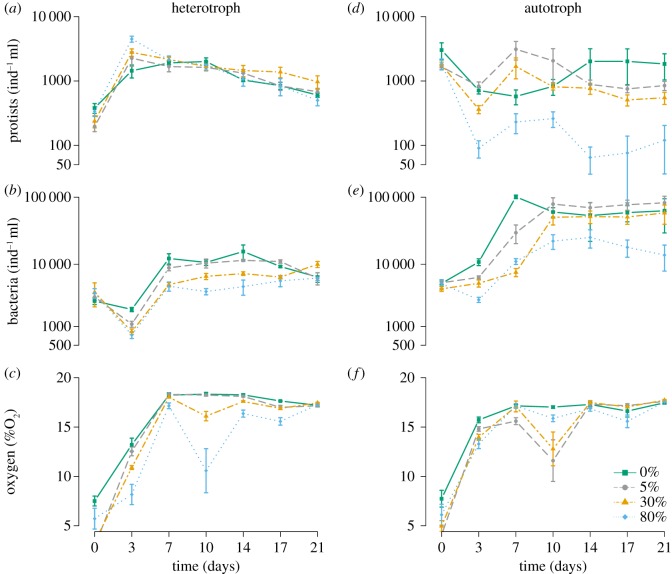
Figure 3.
Temporal dynamics for each diffusion level of protist densities in (a) heterotroph and (d) autotroph ecosystems, bacteria densities in (b) heterotroph and (e) autotroph ecosystems, oxygen concentration in (c) heterotroph and (f) autotroph ecosystems. Panels a, b, d and e are presented on a log-scale. Bars represent ±s.e. for each experimental day. Dispersal and no dispersal treatments were lumped together to produce the figure. (Online version in colour.)

