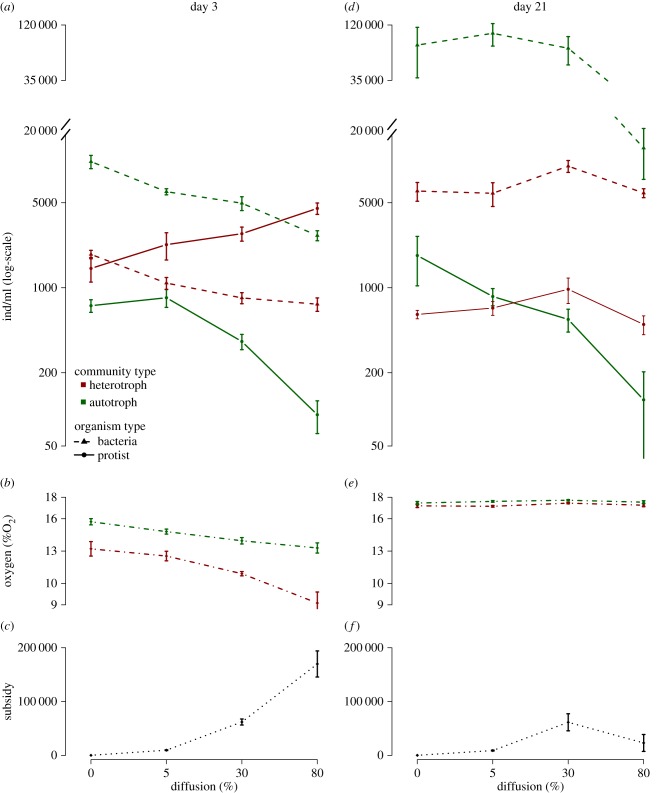
Figure 4.
Effect of diffusion at the beginning (a–c) and at the end (d–f) of the experiment. The upper panels illustrate the effect of diffusion on protist and bacteria densities at day 3 (a) and 21 (d). The middle panels illustrate the effect of diffusion on oxygen concentration at day 3 (b) and 21 (e). The lower panels illustrate the estimated amount of detritus moved from the autotrophic to the heterotrophic ecosystem at the last diffusion procedure before sampling day 3 (c) and 21 (f). Panels (a,d) are presented on a log-scale. Bars represent ±s.e. for each diffusion level. (Online version in colour.)

