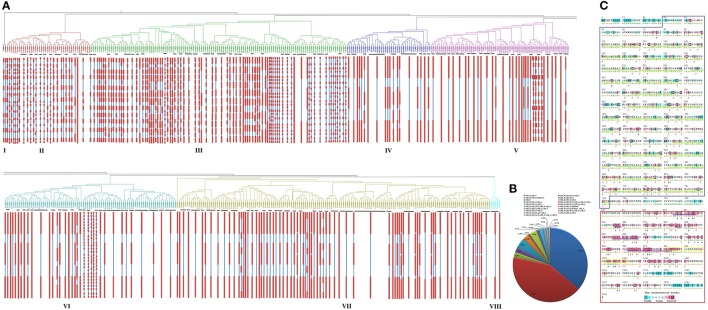
Figure 3.
Gene and protein structure analysis. (A) Exon/intron distribution in TaLRRK genes grouped under various classes of phylogeny is shown. Red and Blue colors indicate the occurrence of exon and intron in various genes. (B) Extracellular domain composition of TaLRRK proteins obtained by blast search at pfam and NCBI conserved domain databases. (C) Conservation of various domain and motifs in TaLRRK proteins obtained by multiple sequence alignment subjected to ConSurf blast. The extracellular LRR domain and Kinase domain are shown in blue and red color boxes, respectively. The LRR motifs are underlined with green color in LRR domain. In kinase domain, ATP binding site/active sites are underlined by purple color, while activation loop is shown in yellow boxes.

