Figure 5.
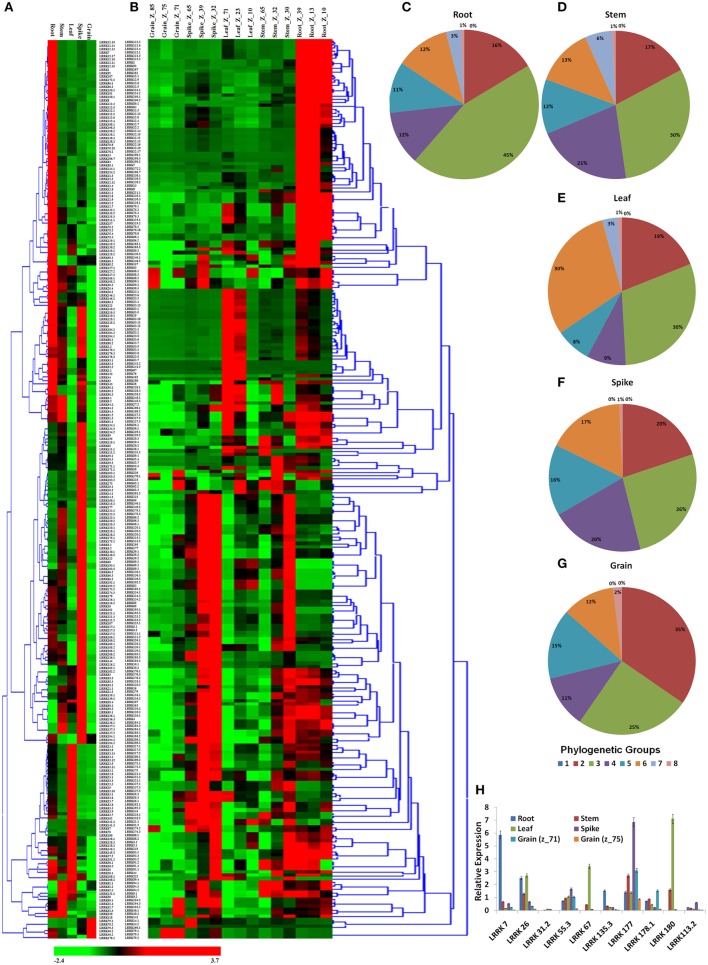
Relative expression profile of TaLRRK genes in various organs and their three developmental stages. Heat map shows relative expression profile of TaLRRKs in five different organs (A) and three developmental stages of each organ (B). Phylogenetic classification of genes with expression value ≥10 RPKM in root (C), stem (D), leaf (E), spike (F), and grain (G) shows evolutionary relationship in genes expressing in same organ. Quantitative real time PCR analysis of 10 selected TaLRRK genes (H) shows relatively similar expression pattern, as observed with transcriptome data.

