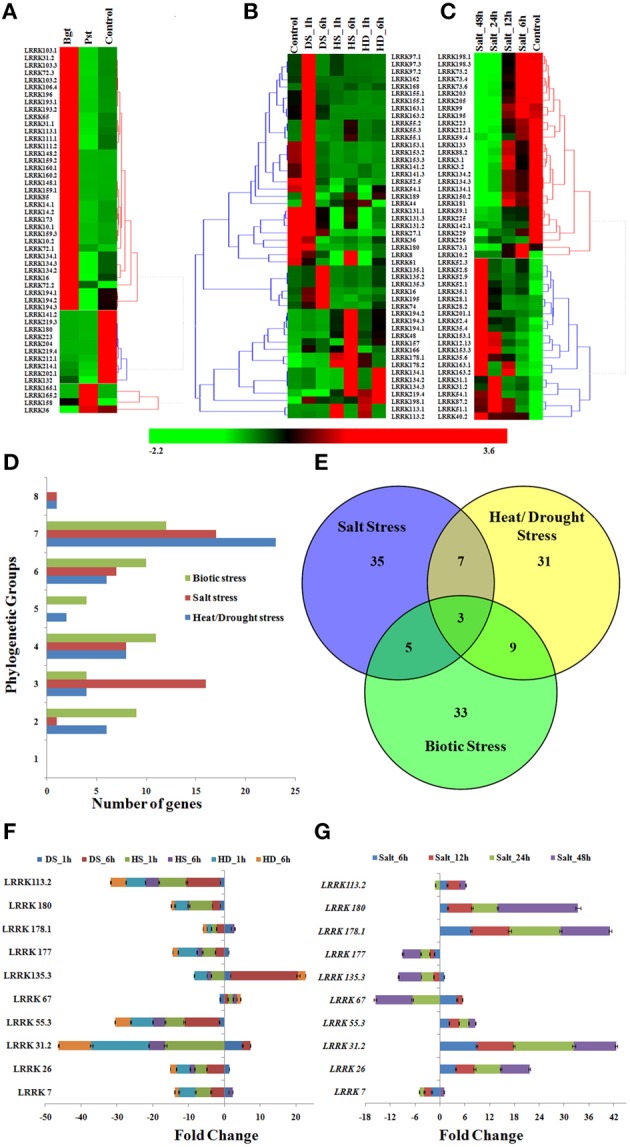
Figure 6.

Expression profile of TaLRRK genes under biotic and abiotic stresses. The heat map shows relative expression of top 50 affected genes under (A) biotic stress, (B) heat/drought stress, and (C) salt stress. The symbols are as follows- Bgt; after Blumeria graminis infection, Pst; after Puccinia striiformis inoculation, HS; heat stress, DS; drought stress, HD; combination of heat and drought stress. (D) The phylogenetic classification of top affected genes under biotic and abiotic stresses. (E) The venn diagram shows the number of exclusive and common top affected genes under various biotic and abiotic stresses. Quantitative real time PCR analysis of 10 selected genes under heat/drought (F) and salt (G) stress shows similar expression pattern as detected from transcriptome data analysis.
