
Figure 7.
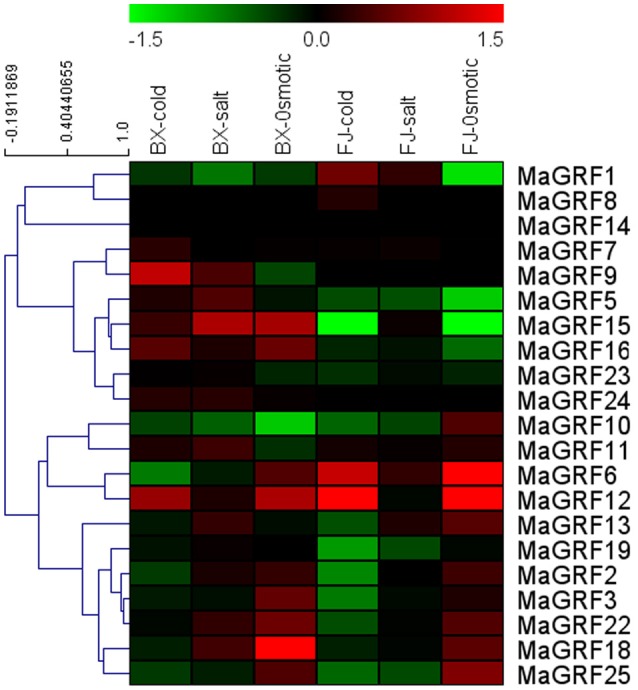
Expression analysis of 14-3-3s in response to cold, salt, and osmotic treatments in two banana varieties. For osmotic and salt treatments, banana seedlings at the five-leaf stage grown in soil were irrigated with 200 mM mannitol or 300 mM NaCl for 7 days, respectively. For cold treatment, banana seedlings were cultured in a growth chamber with a temperature that was maintained at 4°C for 22 h. Log2-based values were used to create the heat-map based on transcriptomic data of 14-3-3s from two independent experiments. The scale represents relative signal intensity values.