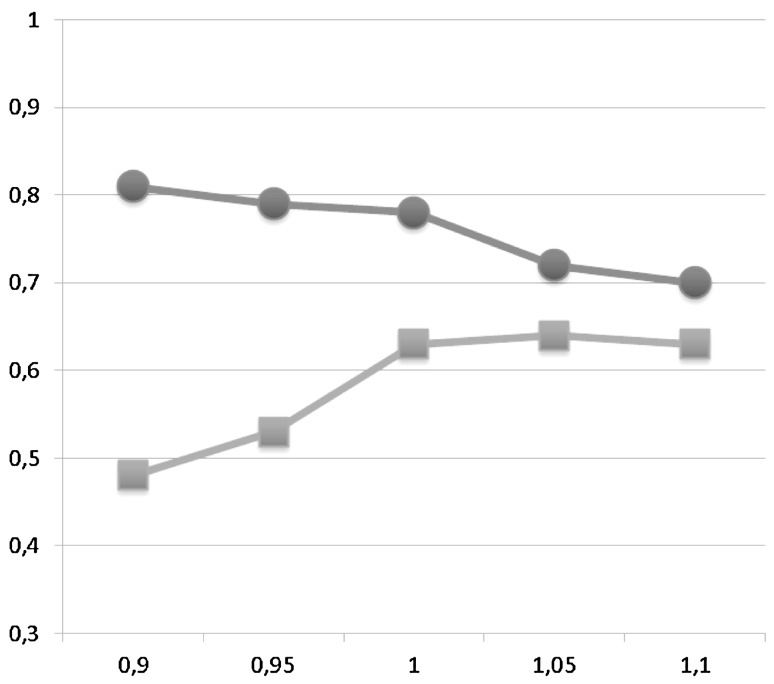
Fig. 2.
Plot of positive and negative predictive values of different cut-offs for pulmonary artery to aorta ratio (PA:A). The X-axis shows the PA:A and the Y-axis the responding positive and negative predictive value. The red line with dot represents the negative predictive value and the blue line with squares the positive predictive value

