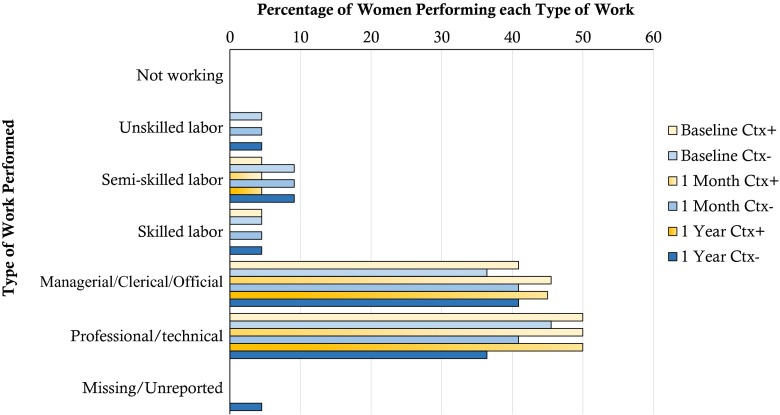
Fig. 1.
Employment status, type of work, and perceived ability to work at baseline, 1-month, and 1-year time points. The figure illustrates the percentages of Ctx+ and Ctx−, respectively, who were classified as working in each type of work (unskilled, semi-skilled, skilled, managerial/clerical/official, or professional/technical) at each time point (BL, 1 M, 1 Y)

