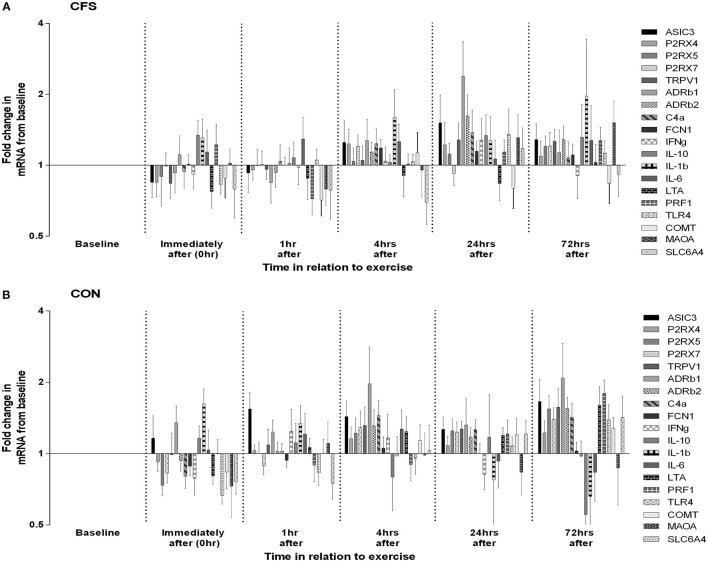
Figure 2.
Changes in leucocyte gene expression following moderate intensity aerobic exercise in (A) patients with CFS (N = 10) and (B) matched healthy control participants (N = 11). Data for each gene at each time-point are depicted as mean (SEM) fold increases from pre-exercise baseline. Graphs are plotted on log2 scale.

