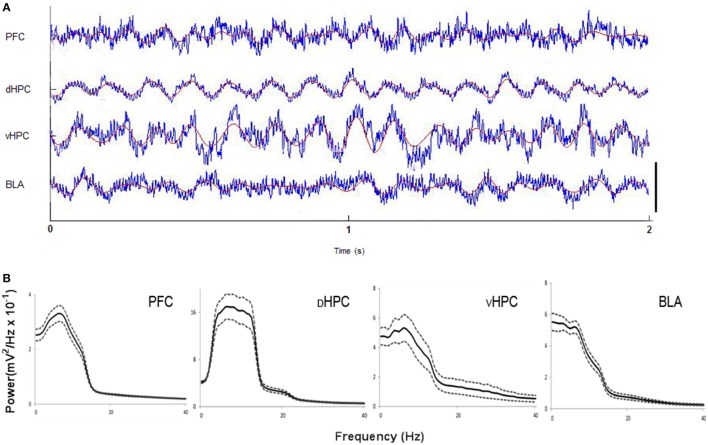
Figure 1.
(A) Representative traces from local field potentials simultaneously recorded from the medial prefrontal cortex (mPFC(PrL)), dorsal hippocampus (dHPC), ventral hippocampus (vHPC) and basolateral amygdala (BLA) in one rat performing the Elevated-Plus Maze (EPM) test. Raw traces are plotted in blue and filtered theta traces (5–12 Hz) are overlayed in red. Presented segment duration is 2 s. Voltage scale (bottom right) is −0.2 to 0.2 mV for mPFC(PrL), vHPC and BLA; and −0.4 to 0.4 mV for dHPC. (B) Power spectra for mPFC(PrL), dHPC, vHPC, and BLA. Spectra are average of multitaper spectrum estimates for all animals (n = 10) during EPM exploration. Dotted lines are ± s.e.m.

