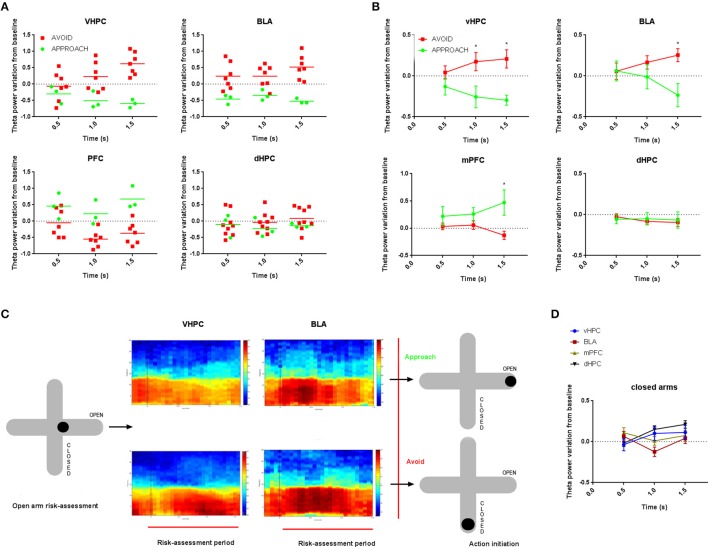
Figure 2.
Comparative time evolution of theta power variation from baseline in vHPC, BLA, mPFC(PrL) and dHPC during open arms risk-assessment preceding approach and avoidance actions (A) for one representative control animal; (B) and averaged for all actions for all control animals. Baseline corresponds to the 0.5 s preceding the exploratory risk-assessment open arm entry. Data was averaged across animals for each time point according to the subsequent action (approach or avoid). (C) Representative average vHPC (left) and BLA (right) spectrograms during open arm risk-assessment preceding approach (top) and avoidance (bottom) actions for one control animal. The spectrogram for each area depicts power in the 0.5–30Hz range during risk-assessment period (0.0 to 1.5 s) and respective baseline (−0.5 to 0.0 s). Dotted line, at 0.0 s, marks the beginning of the exploratory risk-assessment period. (D) Comparative time evolution of mean average theta power variation from baseline following closed arm entry for all control animals in vHPC, BLA, mPFC(PrL), and dHPC. Data was averaged across animals for each time. *p < 0.05 for unpaired Wilcoxon rank sum test comparison of average theta power variation between activity preceding approach and avoidance actions. Error bars, ± sem.

