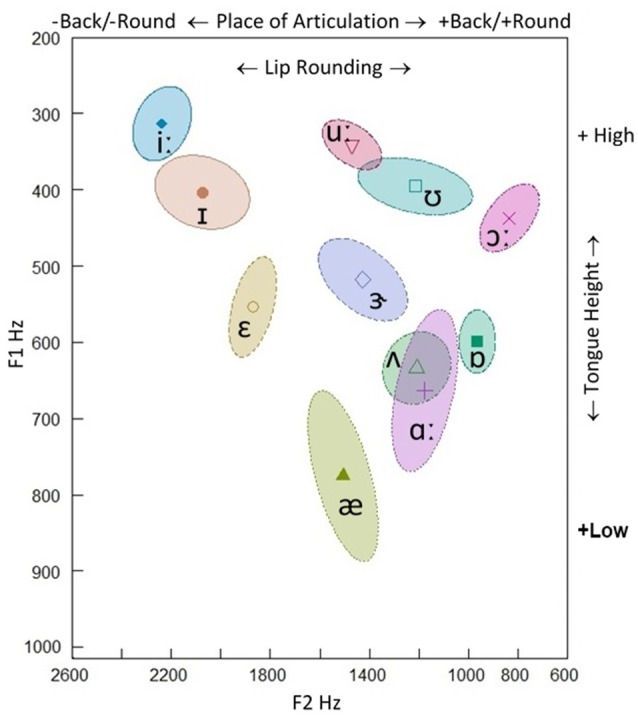
Figure 2.

F1-F2 Hz scatterplot of the stressed British English vowels produced by a native 50-year-old male speaker (our recording). 68.27% confidence ellipse corresponding to ±1 standard deviation from the bivariate mean (the symbol within the ellipse indicates the mean formant value). F1 is inversely correlated with articulatory tongue height (+high/−high), while F2 reflects place of articulation in the horizontal (−back/+back and −round/+round) dimension.
