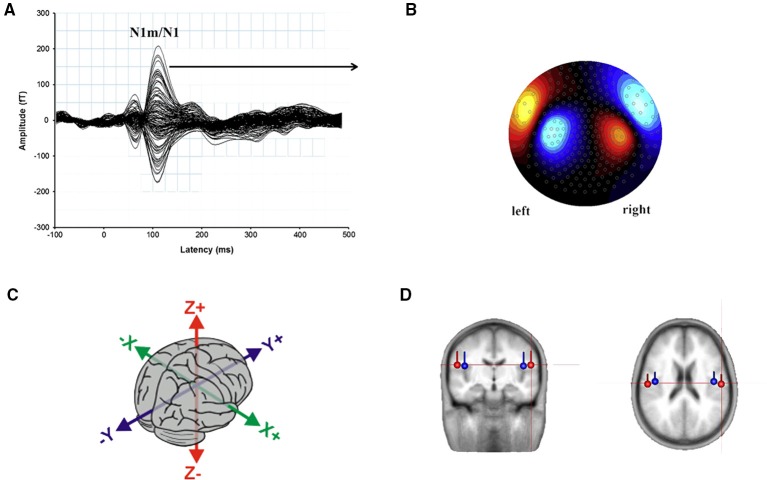
Figure 4.
(A) Representation of the auditory N1m/N1 wave evoked from 275 channels to a kHz tone presented to the right ear. The peak at 100 ms post-stimulus onset, measured in femto-Tesla (fT) is evidenced. (B) The topographic map represents the direction and amplitude of the response at the N1m peak. Adapted from Sereda et al. (2013: p. 302). (C) The 3D space within the brain along the classical Talairach coordinates: The direction of x axis is from left to right, that of y axis to the front, and the z axis thus points up. (D) Average location and orientation of the equivalent current dipole sources fitted in the bilateral auditory cortical areas. Adapted from Cirelli et al. (2014).

