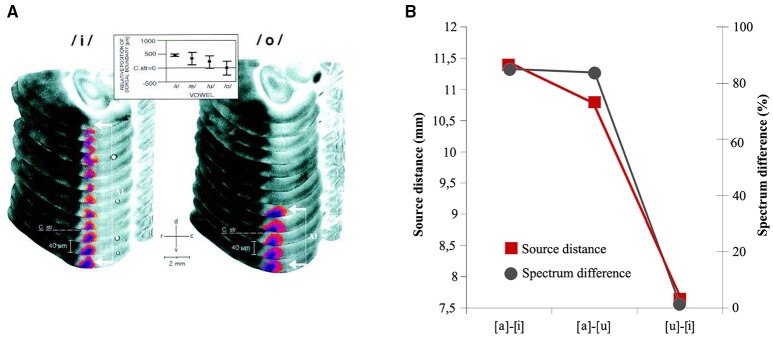
Figure 5.
(A) FDG (2-Fluoro-2-Deoxy-D-[14C(U) Glucose) reconstruction of the activity patterns in left dorsal auditory cortex evoked by vowels [i] and [o] in Gerbils. Vowel representation in field A1 appeared as a dorso-ventral stripe along the isofrequency axis and was highlighted by using a pseudo-color transformation relative to the optical density of the corpus callosum. Large formant distances F2-F1, as in [i], led to stripes that extended far dorsally (white bracket with arrows), whereas stripes obtained with small formant distances, as in [o] ended close to the dorso-ventral level of the roof of the corpus striatum (C str. dashed line). At the top, topographic representation of formant distance F2-F1 along the isofrequency axis in A1 of the vowel-evoked FDG that were used in the study. From Ohl and Scheich (1997: p. 9442). Copyright (1997) National Academy of Sciences, U.S.A. (B) Graphical Representation of the relationship between mean distances of the source locations of [a]–[i], [a]–[u], [u]–[i] vowel pairs—measured via an ECD models- and relative acoustic–phonetic dissimilarity (black line) measured as F2/F1 ratio. The representational centers of the N1m show relative distances that resemble a F2-F1 vowel space and indicate a phonemotopic organization in the supratemporal plane. Adapted from Shestakova et al. (2004: p. 348).

