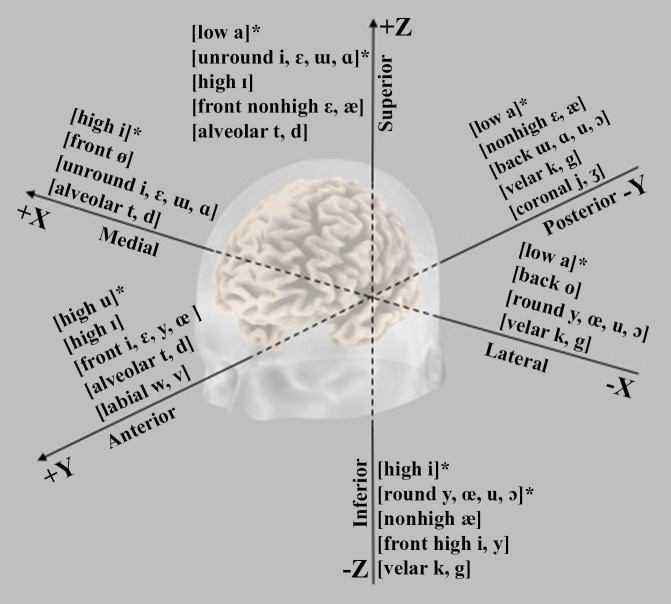
Figure 6.
Graphical representation of the main trends emerging from the N1m ECD analysis along the three-dimensional spaces slicing human brain in lateral-medial (x), anterior-posterior (y), and inferior-superior axis (z). The symbol (*) indicates that the topographical gradient was explained in terms of acoustics effects rather than of featural variables.

