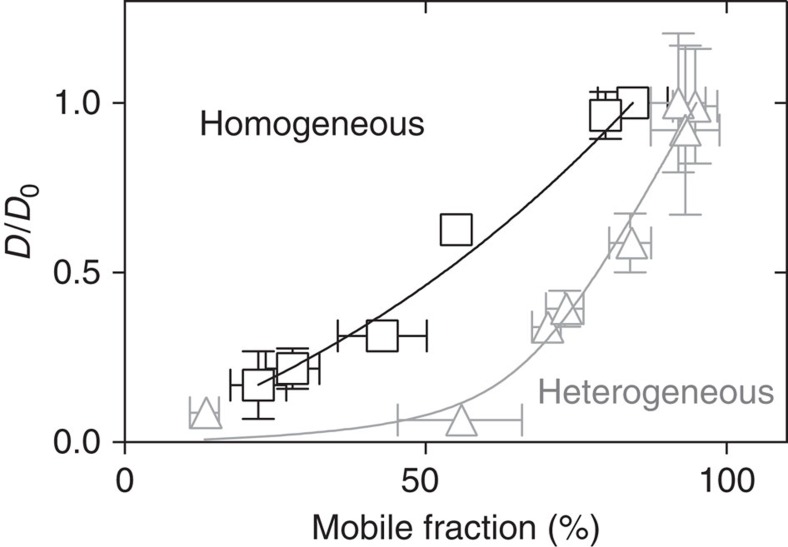
Figure 3. VSG diffusion depends on the density and homogeneity of the protein layer.
Comparison of the diffusion coefficients and the corresponding mobile fractions in homogenous VSG (black squares) and VSG/NeutrAvidin layers (grey triangles, cf. Fig. 2). Diffusion coefficients (D) are normalized to the values for the most dilute situation (D0). The solid lines represent the fit according to equation (6). Data are presented as means±s.d.

