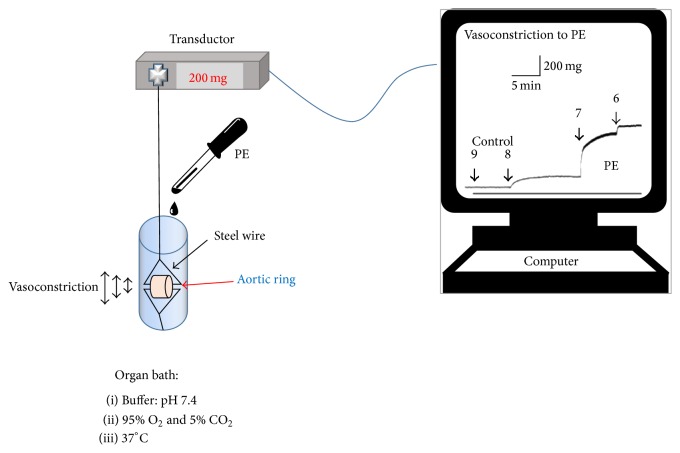
Figure 4.
Vascular reactivity experimental setup. Aortic ring was mounted on two steel wires; the upper one was attached to an isometric transducer. An equilibration period and stabilization with KCl were allowed, and the tissue was washed two times with fresh KRB. Then, we performed the protocol of the experiment; we added different concentrations of PE, which caused vasoconstriction of aortic ring. To finish, data were registered in the computer. The increase of the trace of the screen indicates vasoconstriction to PE, while the decrease of the trace indicates vasodilatation of the aortic ring.

