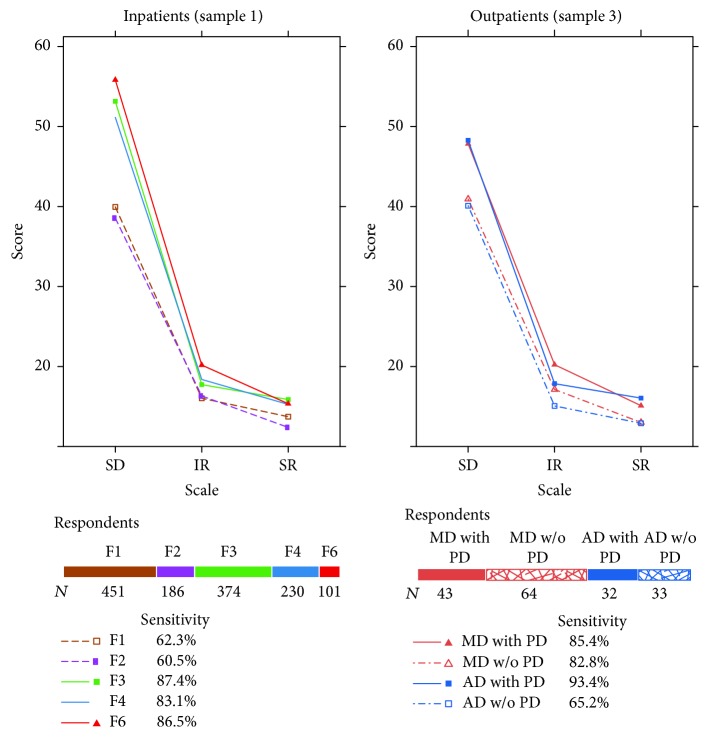
Figure 3.
OQ-45 profiles of the respondents at intake. For sample 3 only data of patients with a principal diagnosis of mood (MD) or anxiety disorder (AD) grouped according to the presence or absence of a personality disorder (PD) are represented. Percentages represent the sensitivity to psychopathology according to the OQ Total Score.

