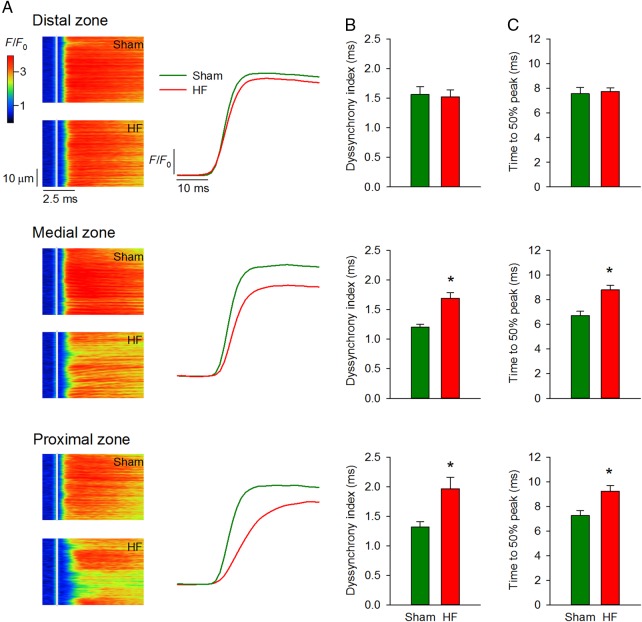
Figure 4.
Ca2+ transients are progressively desynchronized with greater proximity to the infarct. As predicted by distance maps in Figure 3, confocal line-scan images (A) showed progressively more dyssynchronous and slowed Ca2+ transients approaching the infarct. Mean measurements of dyssynchrony index and time to 50% rise of the Ca2+ transient are shown in (B and C), respectively (nSham cells = 82 from three hearts, nHF cells= 83 from four hearts) (*P < 0.05 vs. Sham).

