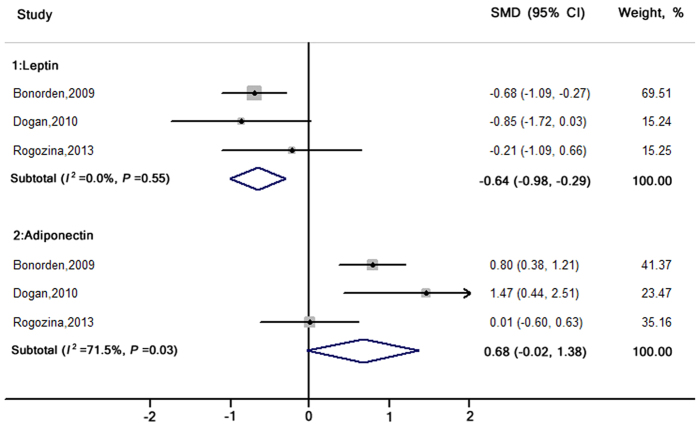
Figure 4. SMDs and 95% CIs for serum leptin and adiponectin levels in genetically engineered animal models.
The pooled estimates were obtained using a random-effects model. The dots indicate the SMDs comparing ICR-R to CCR. The size of the shaded square is proportional to the weight of each study. The horizontal lines represent the 95% CIs. The diamond data markers indicate the pooled SMDs with corresponding 95% CIs. CCR: chronic calorie restriction; CI, confidence interval; ICR: intermittent calorie restriction; ICR-R: restriction period in ICR group; SMD: standardised mean difference.

