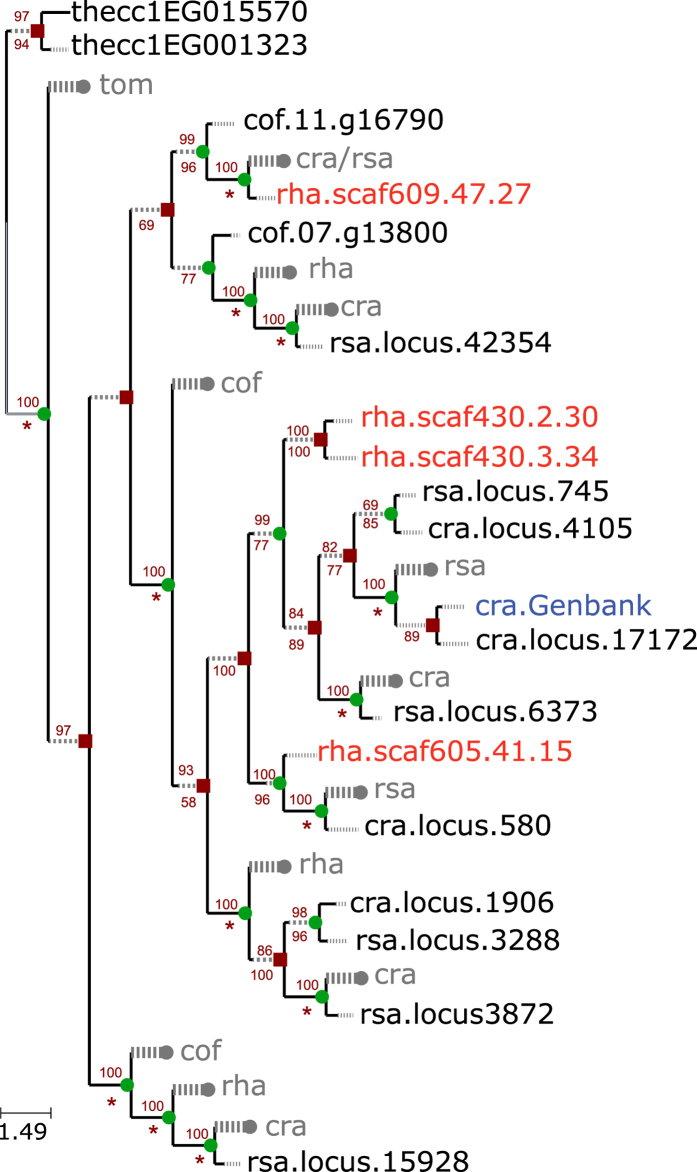
Figure 3. Duplication and loss of Tetrahydroalstonine synthase (THAS) across six angiosperms based on gene tree/species tree reconciliation.
Internal and terminal branches in black reflect the amount of change along branch; dashed gray branch extensions are present for branches whose lengths were too short to enable uniform representation with branch support and length information. cra, Catharanthus roseus; cof, Coffea canephora; rha, Rhazya stricta; rsa, Rauvolfia serpentina; tom, Solanum lycopersicum; the, Theobroma cacao. Species indicated in blue font were downloaded from GenBank and those in red are from Rhazya stricta. Red square = gene duplication; green circle = speciation event; wide gray dashed line ending with a circle = gene loss. Values above branches indicate bootstrap support for the clade, numbers below nodes give bootstrap support for the event (duplication or speciation) at the node. Bootstrap values less than 50 are not shown; inferred loss events are indicated with an asterisk and do not have associated bootstrap values. Scale bar represents number of amino acid substitutions per site. The maximum likelihood (ML) tree shown is the tree with the best ML score.

