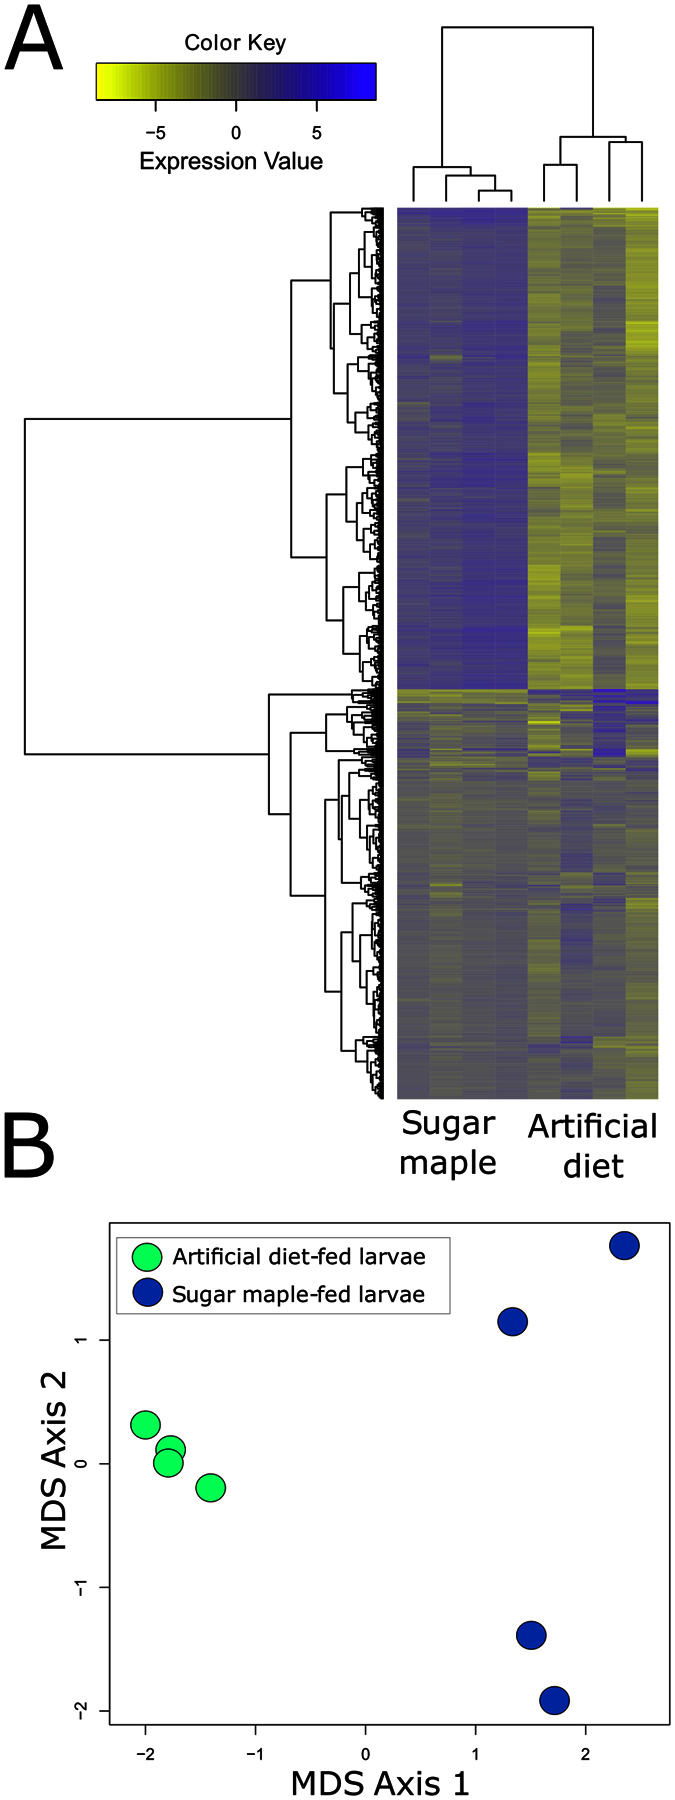
Figure 1.

Heatmap analysis of differentially expressed genes identified in A. glabripennis larvae feeding in sugar maple and artificial diet (A) and MDS analysis of expression patterns of larvae feeding in artificial diet and sugar maple (B). Genes with ≥1.25 or ≤−1.25 log fold changes and FDR adjusted p-values ≤ 0.05 were identified as being differentially expressed. Genes were clustered using Ward’s method and the heatmap was created using ‘heatmap2’ in the R statistical computing environment. Blue indicates higher expression levels; yellow indicates lower expression levels.
