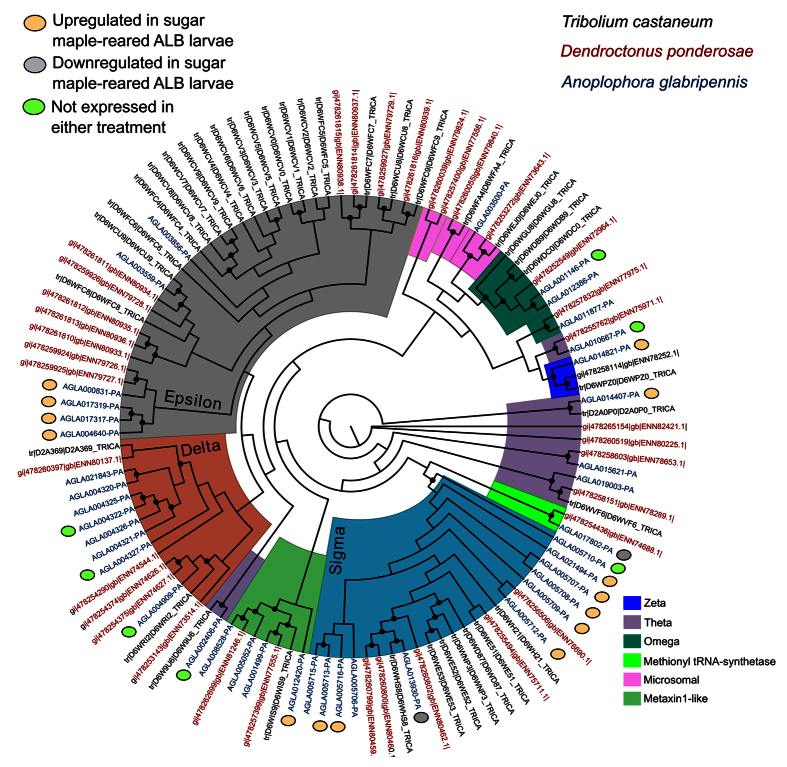
Figure 4. Maximum likelihood analysis of glutathione S-transferases (GSTs) detected in the A. glabripennis genome compared to other wood-feeding colepoterans.
A maximum likelihood analysis of GSTs detected in the A. glabripennis (ALB), mountain pine beetle (MPB), and Tribolium castaneum (red flower beetle) genomes was performed using the program Garli. The LG + I evolutionary model was selected as the optimal rate matrix using ProtTest and 500 bootstrap pseudoreplicates were analyzed. The genes were assigned to clades based on relatedness to red flour beetle and mountain pine beetle GSTs, which had been classified previously8. Brown circles denote GSTs that were induced by feeding in sugar maple, while grey circles denote GSTs that were more strongly induced in the diet-fed larvae.

