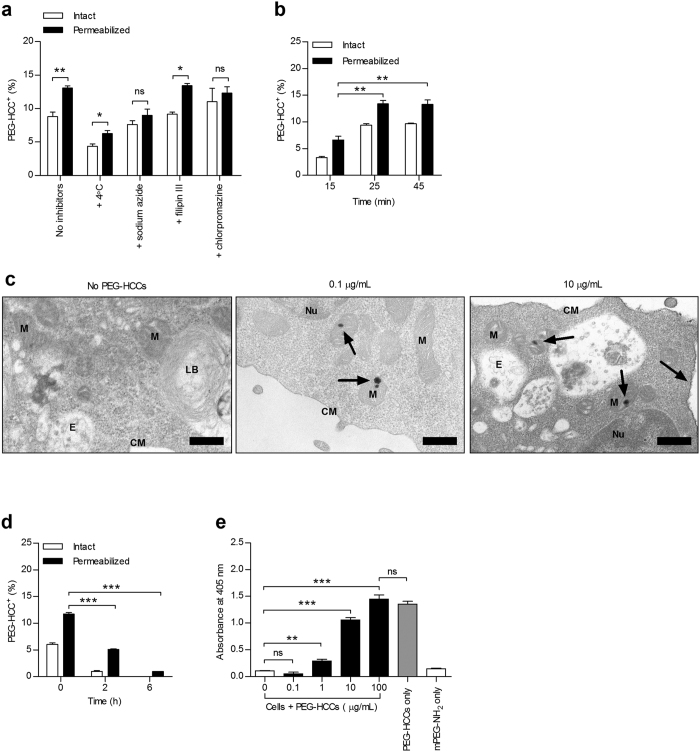
Figure 2. PEG-HCCs are internalized by T lymphocytes via clathrin-mediated endocytosis and do not accumulate inside the cells.
(a) Rat splenic T cell uptake of PEG-HCCs, analyzed by FCM, at 37 °C or 4 °C and after incubation with sodium azide, filipin III, or chlorpromazine (n = 4 spleen preparations; 4000 live T cell singlets analyzed per sample). (b) Kinetics of nanoparticle internalization in splenic T cells incubated for the indicated times with 0.1 μg/mL PEG-HCCs prior to FCM (n = 3 spleen preparations, two-tailed Student’s t test). (c) Subcellular localization of PEG-HCCs in T cells, visualized by transmission electron microscopy, loaded with no PEG-HCCs (left) or a low (0.1 μg/mL, middle) or high (10 μg/mL, right) dose of PEG-HCCs. Arrows point to bundles of PEG-HCCs. Nucleus (Nu); mitochondrion (M); cell membrane (CM); lamellar body (LB); endosome (E). Scale bars, 400 nm. See Supplementary Fig. S10 for more images. (d) Kinetics of nanoparticle loss in splenic T cells incubated for 30 min with 0.1 μg/mL PEG-HCCs, washed, and analyzed by FCM after the indicated times (n = 3 spleen preparations, two-tailed Student’s t test). (e) PEG-HCC exit from splenic T cells measured by a cell-based sandwich ELISA (n = 3 experiments, one-way ANOVA). Mean ± s.e.m. *P < 0.05, **P < 0.01, ***P < 0.001.

