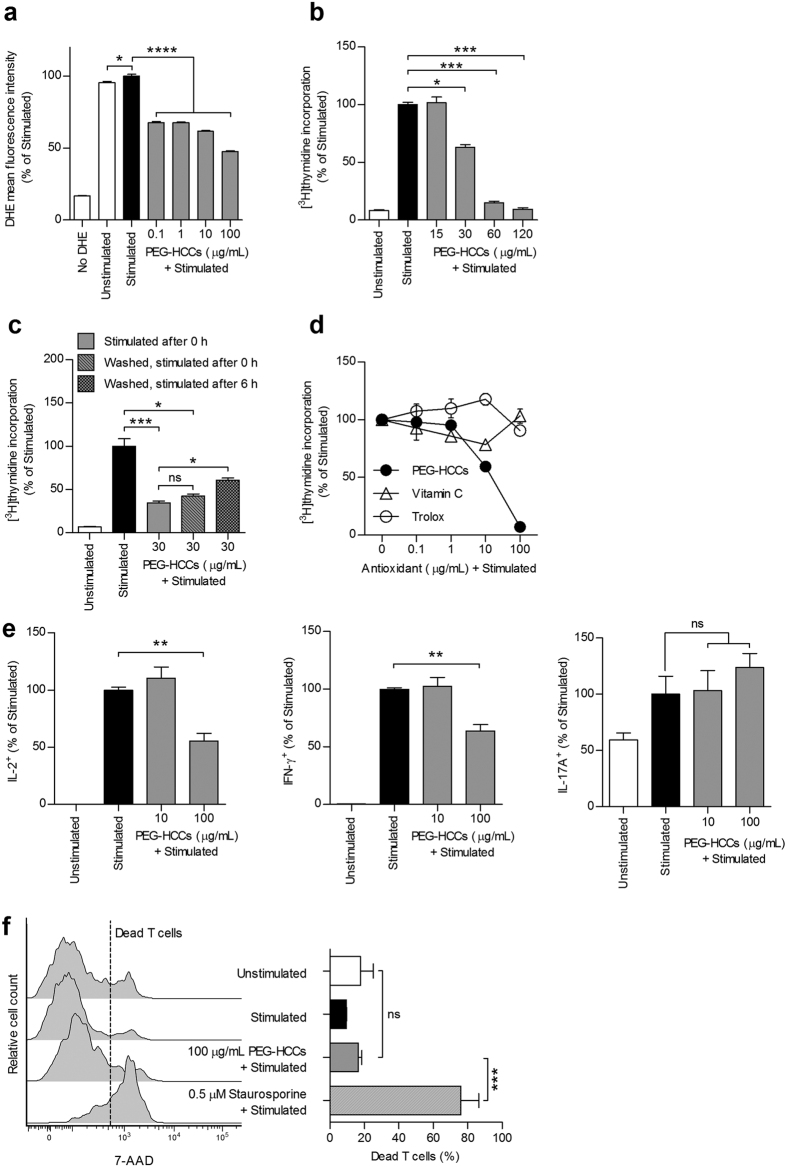
Figure 4. PEG-HCCs scavenge intracellular O2•− and suppress T lymphocyte activity.
(a), Detection of O2•− levels by DHE fluorescence and FCM in primary ovalbumin-specific rat T cells. Cells were stained with dihydroethidium (DHE), incubated with the indicated concentrations of PEG-HCCs, and stimulated with phorbol 12-myristate-acetate (PMA) and ionomycin to induce intracellular O2•− production. Unstained cells and unstimulated cells are shown as controls (n = 3 replicates, one-way ANOVA). (b) Proliferation of antigen-stimulated ovalbumin-specific T cells, measured by [3H] thymidine incorporation, in the presence of the indicated concentrations of PEG-HCCs. Unstimulated cells are shown as controls (n = 3 experiments). (c) Ovalbumin-specific T cells were incubated with PEG-HCCs for 30 min. Cells were then either antigen-stimulated without washing PEG-HCCs away (stimulated after 0 h), or washed to remove excess PEG-HCCs and stimulated immediately (washed, stimulated after 0 h) or 6 h later (washed, stimulated after 6 h) for the measurement of T cell proliferation. Unstimulated cells are shown as controls (n = 3 experiments). (d) Comparison of PEG-HCCs with vitamin C and trolox on the proliferation of antigen-stimulated ovalbumin-specific T cells (n = 3 replicates). (e) Detection by FCM of intracellular proinflammatory cytokines IL-2 (left), IFN-γ (middle) in antigen-stimulated GFP-transduced T cells, and IL-17A (right) in lymph node T cells incubated with the indicated concentrations of PEG-HCCs. Unstimulated cells are shown as controls (n = 3 experiments). (f) Quantification of cell death by FCM in T cells left unstimulated, antigen-stimulated, incubated with PEG-HCCs prior to antigen-stimulation, or antigen-stimulated and treated with staurosporine. Left, representative FCM histograms. Right, data quantification (n = 3 replicates, one-way ANOVA). Mean ± s.e.m. *P < 0.05, **P < 0.01, ***P < 0.001, ****P < 0.0001.

