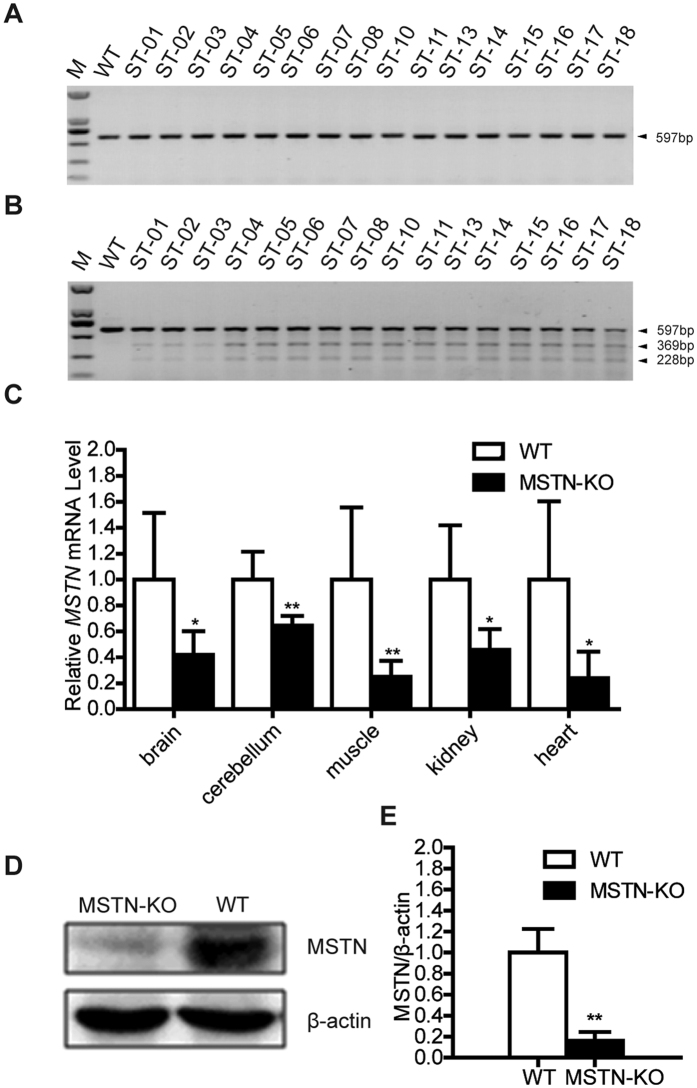
Figure 2. Identification of transgenic lambs.
(A) The detection of the MSTN gene in lambs via PCR. The genomic regions surrounding the target site were amplified, and a 597 base pair PCR product of the MSTN gene was obtained. Analyses of wild-type (WT) lamb and lamb ST-01 to ST-18 genomic regions are shown. (B) Genotyping of MSTN mutant lambs using the T7 endonuclease I assay. MSTN genes of each lamb were assayed and are presented in the same order as the PCR results. Samples showing one band indicate the WT allele, while mutated alleles produced three bands in a Surveyor endonuclease assay. (C) The relative expression levels of MSTN mRNA in the different tissues from MSTN-KO and WT sheep. The relative expression levels of MSTN mRNA in brain, cerebellum, muscle, kidney, heart, liver and kidney tissues of MSTN-KO and WT sheep were measured via q-PCR. But only five tissues have detectable expression of MSTN and were showed. Expression of the GAPDH gene was used to normalize the values of MSTN. *p < 0.05 and **p < 0.01 denote significant differences in MSTN-KO lambs compared with WT lambs. (D) Protein expression levels were assessed via Western blotting. Myostatin protein expression in the muscle tissue of MSTN-KO and WT sheep are shown in cropped blots using an anti-MSTN monoclonal antibody. Anti-β-actin served as a loading control. (E) Quantification of relative MSTN protein levels. The staining intensities of the bands for MSTN and β-actin were quantified using Bio-Rad Image Lab software. Protein levels of MSTN were normalized to β-actin protein levels. **p < 0.01 denotes a significant difference in MSTN-KO lambs compared with WT lambs.

