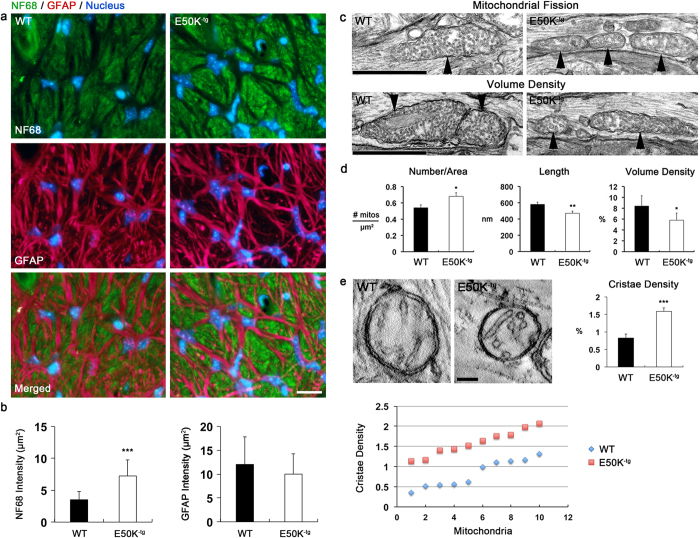
Figure 3. Induction of fission-mediated mitochondrial loss in the axons of the glial lamina in aged E50K−tg mice.
(a,b) Representative images and quantitative immunoreactive intensity analyses from the glial lamina show a significant increase of NF68 immunoreactivity (green) in the axons of 16-month-old aged E50K−tg mice compared with age-matched WT mice. There were no differences in astroglial activation and GFAP immunoreactivity (red) between WT and E50K−tg mice. Blue color indicates nucleus. Scale bar, 20 μm (c) Representative images from TEM analyses show mitochondrial fission and mitochondrial loss in the axons of the glial lamina in 16-month-old aged E50K−tg mice compared with age-matched WT mice. Arrowheads indicate mitochondria. Scale bar, 500 nm. (d) Quantitative TEM analyses of mitochondria show a significant increase of mitochondrial number (n = 20), but decreases of mitochondrial lengths (n = 78 for WT; 92 for E50K−tg mice) and volume density (n = 20) in the axons of the glia lamina of E50K−tg mice. (e) Representative images from TEM analyses show changes in cristae abundance in the mitochondria of the axons in the glial lamina in WT and E50K−tg mice. Quantitative TEM analysis shows a significant increase of mitochondrial cristae density (n = 10 for WT; 10 for E50K−tg mice) in the axons of the glial lamina in E50K−tg mice. Dot graph shows the actual cristae density of each mitochondrion. Data are shown as the mean ± S.E.M. *P < 0.05; **P < 0.01; ***P < 0.001 compared with the WT group. E50K−tg, E50K mutation-carrying transgenic; GFAP, glial fibrillary acidic protein; NF68, neurofilament 68; WT, wild-type. Scale bar, (WT) 500 nm (c), (E50K−tg) 250 nm (c) and (WT and E50K−tg) 100 nm (e).

