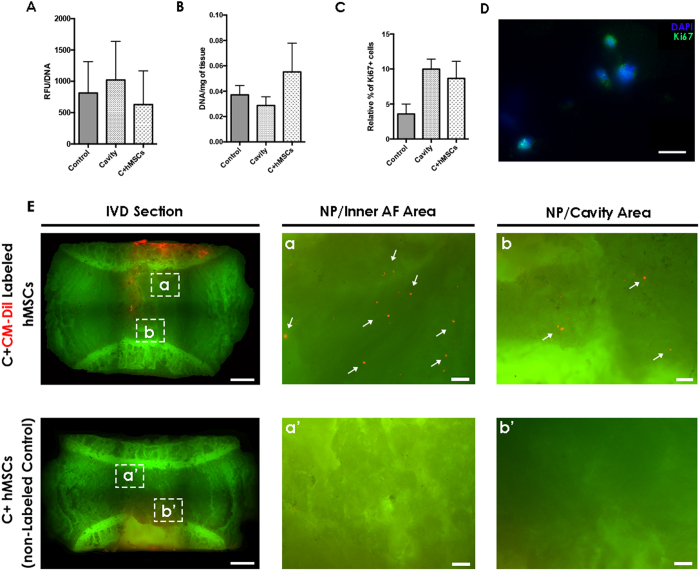
Figure 1. Metabolic activity, DNA, Cell proliferation and hMSCs migration in the IVD tissue after 21 days of culture.
Control, cavity and C + MSCs were compared at day 21 for: (A) metabolic activity, no differences were observed between the groups; (B) DNA content, a slight increase in DNA was observed in the C + hMSCs group; (C) cell proliferation quantification: higher cell proliferation was observed in both lesioned groups (cavity and C + hMSCs). All depicted results are presented as M/D (n = 3-7) without significant differences (Mann-Whitney test). (D) representative image of proliferative Ki67+ cells in the IVD tissue is presented (scale bar: 10 μm). (E) representative image of CM-Dil-labeled hMSCs and the control with non-labeled hMSCs after 21 days in IVD organ culture (scale bar: 2000 μm / magnified image: scale bar: 200 μm). CM-Dil labeled hMSCs can be identified in red in the IVD tissue at day 21.

