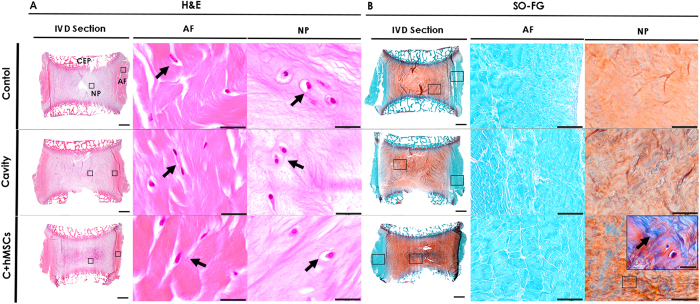
Figure 2. Histological analysis of the IVD tissue after 21 days of culture.
Sagittal sections of the control, cavity and C + hMSCs were stained with (A) H&E and (B) SO-FG. One representative donor was depicted. In the IVD whole section (scale bar: 2000 μm), CEP, NP and AF regions of IVD can be distinguished. Magnifications of NP/AF cells are presented (scale bar: 20 μm) in the H&E staining as well as magnifications of the whole AF/NP tissue in SO-FG (scale bar: 200 μm). Collagens are visualized by green/blue (arrow) color while GAG are observed in orange color. A higher intensity of orange color in the C + hMSCs group NP suggested a higher proteoglycan content in the tissue of this experimental group.

