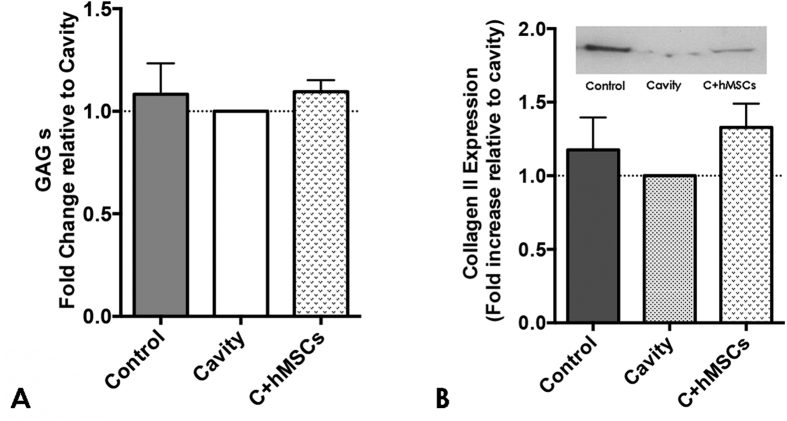
Figure 3. GAG and Collagen type II quantification in the NP tissue at day 21.
The NP tissue of the three experimental groups was digested and afterwards analyzed for GAG and Col type II content. (A) Fold increase in GAGs content. GAG content was similar between the groups (n = 4). (B) Fold increase in Col type II and a representative image of a blot. Col type II content was determined by WB and values normalized to the total protein and presented as fold increase to the cavity group; a slight increase in Col type II was observed in the C + hMSCs group compared with the cavity (no statistically significance in raw data, Mann-Whitney test (n = 7)). Results are presented as M/D.

