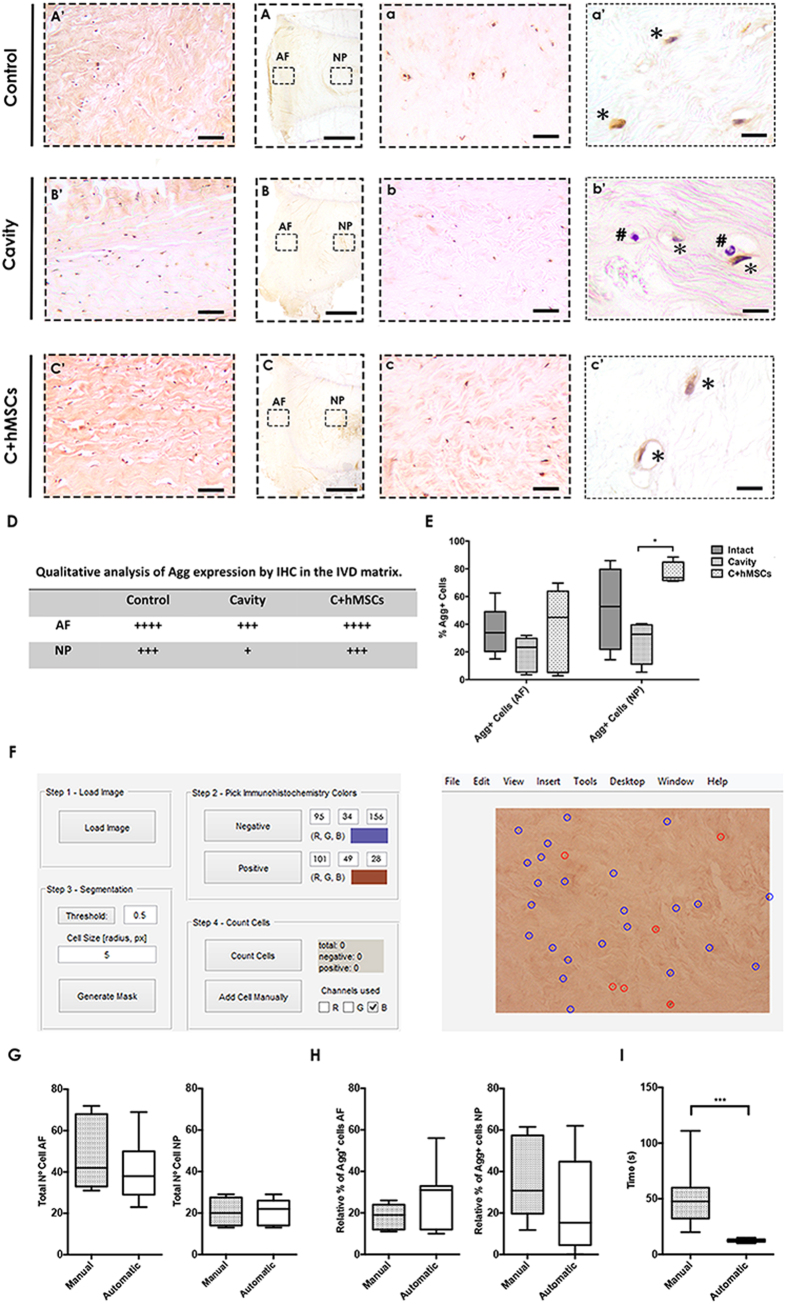
Figure 4. Aggrecan expression and quantification in the IVD tissue at day 21.
Agg expression in the tissue was evaluated by IHC and displayed both matrix and cellular staining. (A–C) Overall Agg expression in the tissue. One representative donor is presented (scale bar-2000 μm). (A′–C′) Magnified representative images of Agg matrix and celular expression in the AF area (scale bar-200 μm). (a,b) Magnified representative images of Agg matrix and celular expression in the NP area (scale bar-200 μm). (a′–c′) High magnification images of cellular Agg expression in the NP (scale bar 20 μm). (D) Qualitative analysis of Agg matrix expression both in the AF and NP area. Cavity group displayed a less Agg matrix expression when compared to the control and the C + hMSCs group. (E) Quantification of Agg cellular expression (Agg+ cells were quantified using ImmunoCellCount software). Agg+ cells could be distinguished by a characteristic brown color, in co-localization with the hematoxylin purple staining. A significant reduction of Agg expression is observed in the cavity group in both AF and NP areas, while a significant increase is observed in the presence of hMSCs. Results are presented as box-and-whiskers plots (n = 5). (F) ImmunoCellCount software. Image on the left side, GUI where the settings can be established and on the right side, the image after the classification. Comparison between manual assessment of Agg deposition vs automatic using the ImmunoCellCount software was performed in both AF and NP, concerning: (G) Total number of cells; (H) Relative % of Agg+ cells; (I) Time of the analysis. No significant differences were observed between the two methods, but a there was a significant improvement in the time consumed for image analysis. Results are presented as box-and-whiskers plots (n = 5). Statistical analysis was performed using Mann-Whitney test (*p < 0.05; ***p < 0.001).

