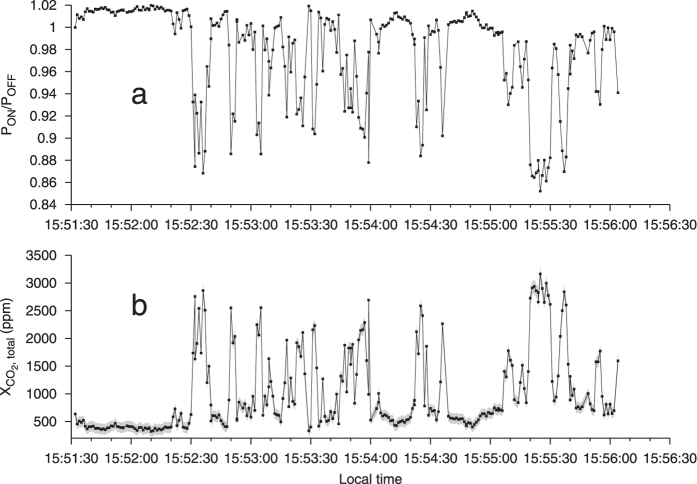
Figure 2. Near field static measurement at Pisciarelli.
The range was 55 m. (a) Normalized intensity ratio (GR, Methods). Decrease indicates presence of excess CO2. The strong, pulse-like modulation of the GR is indicating the presence of large amounts of CO2. (b) Total path averaged CO2 concentrations obtained from CO2 path length concentration products (path-amounts) after dividing by the range (path length). At times they are over 3000 ppm. As in all of the following figures, the grey envelope depicts precision (1 SD, Equation (9) in Methods). Each point corresponds to 784 ms integration time.

