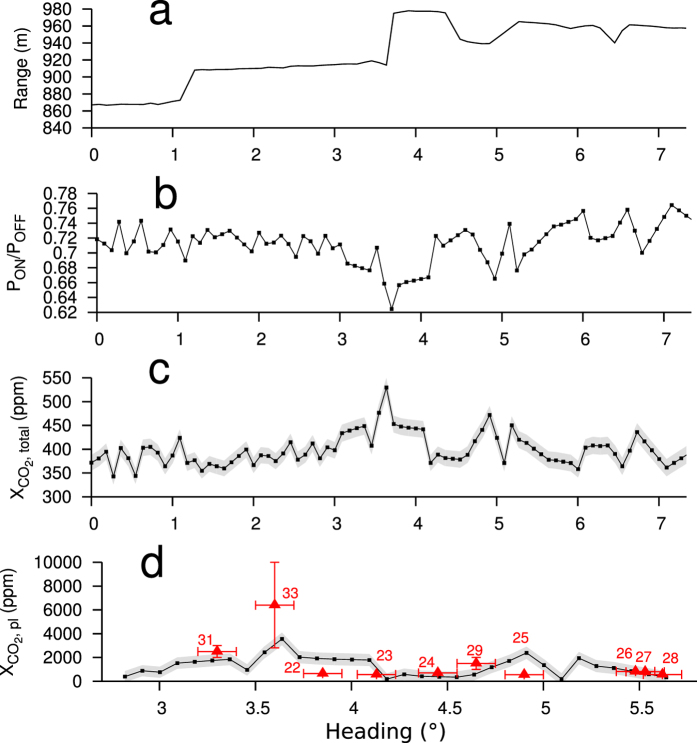
Figure 3. Example of far field scan at Pisciarelli.
(a) Range measurements versus scan angle (heading). The ranges were measured using a range finder LIDAR (Methods). They defined the path length. (b) Grand ratio (GR) versus heading. (c) Total path averaged CO2 concentration. Also shown is the measurement precision (1 SD) in grey. (d) In-plume CO2 concentrations. They were derived from data in c) using Equation 4 (Methods). The numbered triangles depict the values and ranges as well as lateral position uncertainties of the in situ measurements (Fig. 1c). Note that these have been acquired ~20h earlier. Thus, they serve as approximate reference only. Moreover, concentrations in d) from the CO2DIAL represent path averages with contributions from across the plume, while the in situ values show concentrations measured at a single point in the plume.

