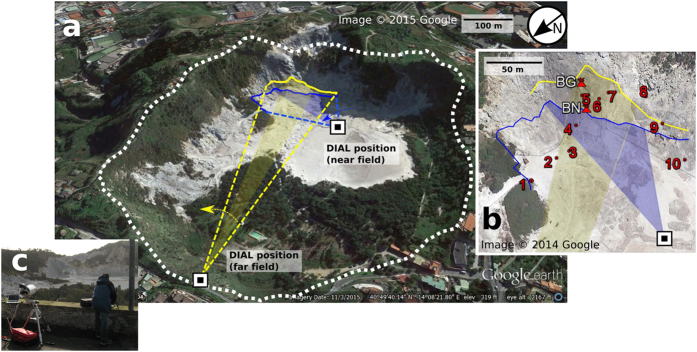
Figure 4. Overview of the measurement geometry at Solfatara.
(a) Solfatara crater. The crater area is marked by the white dotted line. The extension of the far and near field scans and scan is indicated by dotted lines. The curved arrows mark the scan direction. Shaded areas depict regions of interest, i.e. the sectors for which flux results are reported in Table 1 (blue near field, yellow far field). The target distances versus heading are indicated for the near and far field scans (blue and yellow lines). (b) Nadir photo showing a zoom around the main fumaroles. Shown are the in situ measurement points and the locations of the main fumaroles Bocca Nuova (BN) and Bocca Grande (BG). (c) Photo of the CO2DIAL while measuring from the far field position.

