
Figure 4. Comparison of each retinal layer thickness between eyes with retinitis pigmentosa and controls.
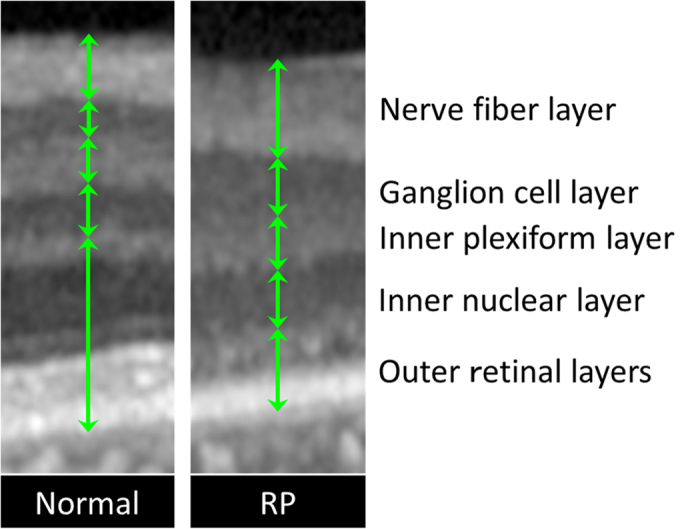
Magnified image of the white square in Fig. 3 and corresponding area of normal control. The thickness of each layer was measured and compared.
Official websites use .gov
A
.gov website belongs to an official
government organization in the United States.
Secure .gov websites use HTTPS
A lock (
) or https:// means you've safely
connected to the .gov website. Share sensitive
information only on official, secure websites.
Magnified image of the white square in Fig. 3 and corresponding area of normal control. The thickness of each layer was measured and compared.