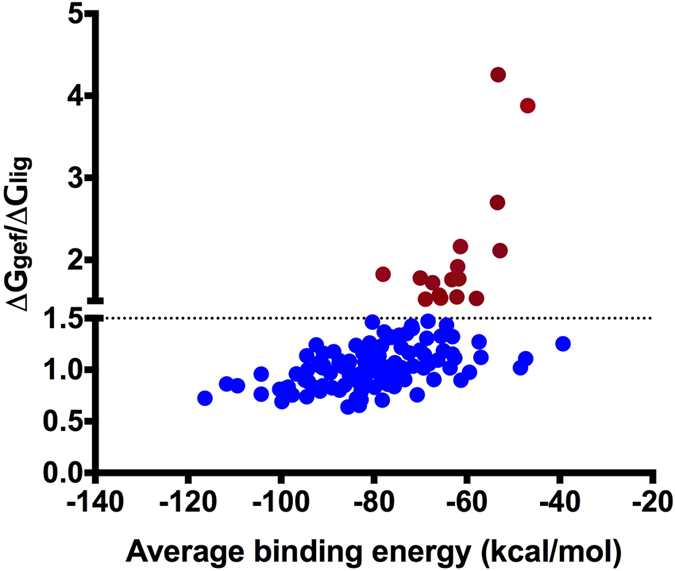
Figure 4. Comparison of the binding energies of gefitinib (∆Ggef) and the respective bound ligand (∆Glig) with the off-target structures.

The ratio of gefitinib and reported ligand binding energies (∆Ggef/∆Glig) were plotted against the average binding energy of both. The dotted line shows the threshold ratio 1.5. The spheres with read colour show the significant ratio above the threshold value.
