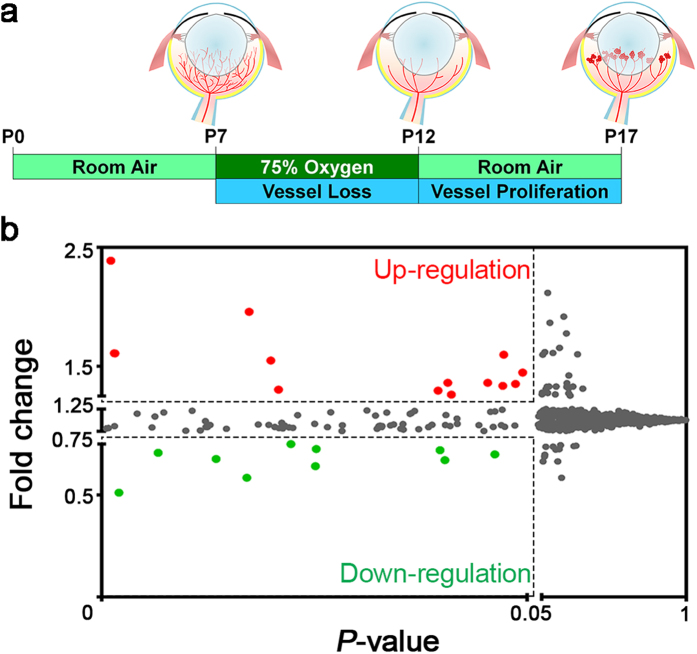
Figure 1. MiRNA levels were altered in the mouse retinas with oxygen-induced retinopathy (OIR).
(a) Schematic diagram of the OIR model. Neonatal mice were exposed to 75% oxygen from postnatal day (P) 7 to P12 and returned to room air from P12 to P17 to induce maximum pathologic neovascularization at P17. Total RNAs were isolated from OIR-exposed or age-matched normoxic control mouse retinas at P17 (n = 3 per group) and subsequently applied to Affymetrix GeneChip miRNA array chips for analyzing small non-coding RNAs (sncRNAs), including mature miRNAs, pre-miRNAs (stem-loops), and snoRNAs. There were 1,412 mouse (Mus musculus) miRNAs on the array chip. (b) A dot plot illustrates the mean fold changes of miRNA expression in OIR compared with normoxic retinas versus their P-value. Each dot represents one miRNA (including pre-miRNA). Among all analyzed miRNAs, 0.92% of them (13 miRNAs, as red dots) were up-regulated at more than 1.25-fold, and 0.71% (10 miRNAs, as green dots) were down-regulated in OIR retinas at less than 0.75-fold.

